
Thank you Radiological Society of North America (RSNA®), Society of Thoracic Radiology (STR), and Kaggle for hosting this fun competition. Thank you Nvidia for providing compute resources.
\nThis has been one of my favorite competitions. I enjoyed building an elaborate multi-stage pipeline of stacked models! Working with 3D images was fun and provided an additional challenge compared with 2D images. I particularly enjoyed tackling the challenge of building a fast experimentation pipeline when the training data is 1_000_000_000_000 bytes of data! One trillion bytes! This is the largest dataset I have ever worked with.
In the figure below, each row is an exam (i.e. study, i.e. single patient). The row of images are CT scan \"slices\" from the 3D image of a patient's chest. In this competition, we need to predict 9 targets for each patient (each row) (like is pe on left side? on right side? etc) and we need to classify every image (is pe present?). If below were all the data, then we would need to predict 3 rows * 9 targets = 27 exam targets and 15 images * 1 target = 15 image targets. In total we would need to predict 42 targets.
On the description page, the metric seems very confusing. However it is just a weighted average of 10 log losses (the 9 types of exam predictions and the 1 type of image prediction). (I explain the metric here). After computing the 10 weights, we find that 50% of our LB score is from the 9 exam predictions and 50% of our LB score is from the image predictions. Furthermore, the log loss for the image predictions is itself a weighted log loss where an image that is part of an exam without pulmonary embolism has weight zero (very important observation!)
\ninp = tf.keras.Input(shape=(320, 320, 1)) # INPUT IS UINT8\nx = tf.keras.layers.Concatenate()([inp/255., inp/255., inp/255.])\nbase_model = efn.EfficientNetB4(weights='imagenet', include_top=False) \n\nx = base_model(x)\nx = tf.keras.layers.GlobalAveragePooling2D()(x) \nx = tf.keras.layers.Dense(1, activation='sigmoid')(x)\n\nmodel = tf.keras.Model(inputs=inp, outputs=x)\nopt = tf.keras.optimizers.Adam(lr=0.000005)\nmodel.compile(loss='binary_crossentropy', optimizer = opt)\n\nmodel.fit(X, y, sample_weight = X.groupby('StudyInstanceUID') \n .pe_present_on_image.transform('mean') * 5.6222 )\nI built two models. Model one predicts image level predictions (i.e. pe_present_on_image) and model two predicts patient level predictions (i.e. exams i.e. studies, like leftsided_pe etc)
imagenetuint8LR = 5e-6Below illustrates my augmentations. For display purposes, we illustrate Mixup with a large yellow, green, or blue square so you can see it better. (During runtime, it was an actual second image).
\n
Each patient has an average of 200 images. Among those 200, if PE is present, it is usually on the middle slices. Therefore I only train my patient level model with slices 0.35 < z < 0.65. Then to predict the 9 targets for each patient, I only infer 0.35 < z < 0.65 and then take the 9 average predictions.
uint80.35 < z < 0.65weighted_log_loss
How do we discover the details above? All the settings above were discovered by performing dozens of experiments on smaller images and smaller backbones. For example, use 128x128 (with 80x80 crops) EfficientNetB0 and/or 256x256 (with 160x160 crops) EfficientNetB2. Using these smaller models, we can test out ideas on a single GPU in minutes! Also note that we only use 1 channel images of uint8. This is 33% less data than converting images to 3 channels of 3 different CT window schemes.

Remember we are only training with 30% original data. Then using crops makes it 12% of data. Then using 256x256 reduces this to 3% of data. And using 128x128 reduces this to 0.75% of data! Even Kaggle notebooks P100 GPU can train quickly on 80x80 crops from 128x128 and 30% train data.
\nOnce you find a configuration that works well, then run 512x512 with EfficientNetB4 overnight. Using only 2D predictions for image and 2D predictions for patient, the above two models obtain LB 0.215 and CV 0.235.
\nWe will now increase our CV LB by building stage 2 models that use stage 1 predictions as input
\nFEATURES = ['oof']\nfor k in NEIGHBORS:\n tmp = train.sort_values('PosZ').groupby('StudyInstanceUID')[['oof']]\n train['b%i'%k] = tmp.shift(k)\n train['a%i'%k] = tmp.shift(-k)\n FEATURES += ['a%i'%k, 'b%i'%k]\ntrain.fillna(-1,inplace=True)\n\nmodel = RandomForestClassifier(max_depth=9, n_estimators=100, \n n_jobs=20, min_samples_leaf=50)\nmodel.fit(train.loc[idxT,FEATURES],train.loc[idxT,'pe_present_on_image'],\n sample_weight = 5.6222 * valid.loc[idxT,'weight'])\nAll images are slices from 3D images. So adjacent images (within the same exam) contain helpful information. Each plot below displays all 200 or so image level predictions from 1 study. The x axis is z position and the y axis is the prediction value (0 to 1). The blue line is the ground truth, the orange line is the prediction from the model described above. The black line is the random forest Stage 2 model.
\nFor each image level prediction, a random forest model takes as input the prediction and neighbor predictions [1,2,3,4,5,6,7,8,9,10,15,20,25,30,35,40,45,50,60,70,80,90,100,150,200,250] on either side. Then the random forest model predicts a new image level prediction display in black below. Notice when the original prediction is close to 1, then the random forest pushes it up to 1 and when the original prediction is close to 0, then the random forest pushes it down to 0.
\nThis stage 2 image level model increased LB to 0.204 from 0.215 and CV to 0.224 from 0.235 (gain = 0.011)
\n
inp = L.Input(shape=(64, 1792))\nx = L.Bidirectional(L.GRU(48, return_sequences=True, \n kernel_initializer='orthogonal'))(inp)\nx = L.Bidirectional(L.GRU(48, return_sequences=False, \n kernel_initializer='orthogonal'))(x)\nx = L.Dense(9, activation='sigmoid')(x)\n\nmodel = tf.keras.Model(inputs=inp, outputs=x)\nopt = tf.keras.optimizers.Adam(lr=0.00005)\nmodel.compile(loss=weighted_log_loss, optimizer = opt)\nSimilarly we can use adjacent slice information to improve our patient level predictions. Most patients have between 160 and 310 images per study.
\n
Below are plots of the top view (Z position is vertical axis) of the 3D image (not the ordinary slice view of the 3D image). We notice that most of the crucial information is between 25% and 75% in top view. Therefore we extracted 64 images equally spaces between 25% and 75% Z position. Then we took those 64 images and extracted the GAP embeddings from both our stage 1 model one and stage 1 model two. We trained a stage 2 GRU model and a stage 2 1D-CNN model to predict exam level predictions from these 64 GAP embeddings.
\n
This stage 2 exam level model increased LB to 0.183 from 0.204 and CV to 0.203 from 0.224 (gain = 0.021)
\nWhen using global average pooling 2D in your CNN, location information is lost. Therefore I tried giving my models location information in various ways to help predict targets related to location (i.e. leftsided_pe etc) and related to size (i.e. rv_lv_ratio_gte_1 etc). Unfortunately, none of my ideas increased CV or LB. My favorite is below.
I extracted class activation maps from my stage 1 models and feed the location information into stage 2 exam models. (CAMs explained here). In the below figure, the ground truth is in the title. The green circles are the CAM of my EfficientNetB4 model. Note that CT scans are flipped so the left side of the image is \"right\" and the right side of the image is \"left. You can see that the CAM does a good job of locating the PE.
\n
Thank you Radiological Society of North America (RSNA®), Society of Thoracic Radiology (STR), and Kaggle for hosting this fun competition. Thank you Nvidia for providing compute resources.
\nThis has been one of my favorite competitions. I enjoyed building an elaborate multi-stage pipeline of stacked models! Working with 3D images was fun and provided an additional challenge compared with 2D images. I particularly enjoyed tackling the challenge of building a fast experimentation pipeline when the training data is 1_000_000_000_000 bytes of data! One trillion bytes! This is the largest dataset I have ever worked with.
In the figure below, each row is an exam (i.e. study, i.e. single patient). The row of images are CT scan \"slices\" from the 3D image of a patient's chest. In this competition, we need to predict 9 targets for each patient (each row) (like is pe on left side? on right side? etc) and we need to classify every image (is pe present?). If below were all the data, then we would need to predict 3 rows * 9 targets = 27 exam targets and 15 images * 1 target = 15 image targets. In total we would need to predict 42 targets.
On the description page, the metric seems very confusing. However it is just a weighted average of 10 log losses (the 9 types of exam predictions and the 1 type of image prediction). (I explain the metric here). After computing the 10 weights, we find that 50% of our LB score is from the 9 exam predictions and 50% of our LB score is from the image predictions. Furthermore, the log loss for the image predictions is itself a weighted log loss where an image that is part of an exam without pulmonary embolism has weight zero (very important observation!)
\ninp = tf.keras.Input(shape=(320, 320, 1)) # INPUT IS UINT8\nx = tf.keras.layers.Concatenate()([inp/255., inp/255., inp/255.])\nbase_model = efn.EfficientNetB4(weights='imagenet', include_top=False) \n\nx = base_model(x)\nx = tf.keras.layers.GlobalAveragePooling2D()(x) \nx = tf.keras.layers.Dense(1, activation='sigmoid')(x)\n\nmodel = tf.keras.Model(inputs=inp, outputs=x)\nopt = tf.keras.optimizers.Adam(lr=0.000005)\nmodel.compile(loss='binary_crossentropy', optimizer = opt)\n\nmodel.fit(X, y, sample_weight = X.groupby('StudyInstanceUID') \n .pe_present_on_image.transform('mean') * 5.6222 )\nI built two models. Model one predicts image level predictions (i.e. pe_present_on_image) and model two predicts patient level predictions (i.e. exams i.e. studies, like leftsided_pe etc)
imagenetuint8LR = 5e-6Below illustrates my augmentations. For display purposes, we illustrate Mixup with a large yellow, green, or blue square so you can see it better. (During runtime, it was an actual second image).
\n
Each patient has an average of 200 images. Among those 200, if PE is present, it is usually on the middle slices. Therefore I only train my patient level model with slices 0.35 < z < 0.65. Then to predict the 9 targets for each patient, I only infer 0.35 < z < 0.65 and then take the 9 average predictions.
uint80.35 < z < 0.65weighted_log_loss
How do we discover the details above? All the settings above were discovered by performing dozens of experiments on smaller images and smaller backbones. For example, use 128x128 (with 80x80 crops) EfficientNetB0 and/or 256x256 (with 160x160 crops) EfficientNetB2. Using these smaller models, we can test out ideas on a single GPU in minutes! Also note that we only use 1 channel images of uint8. This is 33% less data than converting images to 3 channels of 3 different CT window schemes.
Remember we are only training with 30% original data. Then using crops makes it 12% of data. Then using 256x256 reduces this to 3% of data. And using 128x128 reduces this to 0.75% of data! Even Kaggle notebooks P100 GPU can train quickly on 80x80 crops from 128x128 and 30% train data.
\nOnce you find a configuration that works well, then run 512x512 with EfficientNetB4 overnight. Using only 2D predictions for image and 2D predictions for patient, the above two models obtain LB 0.215 and CV 0.235.
\nWe will now increase our CV LB by building stage 2 models that use stage 1 predictions as input
\nFEATURES = ['oof']\nfor k in NEIGHBORS:\n tmp = train.sort_values('PosZ').groupby('StudyInstanceUID')[['oof']]\n train['b%i'%k] = tmp.shift(k)\n train['a%i'%k] = tmp.shift(-k)\n FEATURES += ['a%i'%k, 'b%i'%k]\ntrain.fillna(-1,inplace=True)\n\nmodel = RandomForestClassifier(max_depth=9, n_estimators=100, \n n_jobs=20, min_samples_leaf=50)\nmodel.fit(train.loc[idxT,FEATURES],train.loc[idxT,'pe_present_on_image'],\n sample_weight = 5.6222 * valid.loc[idxT,'weight'])\nAll images are slices from 3D images. So adjacent images (within the same exam) contain helpful information. Each plot below displays all 200 or so image level predictions from 1 study. The x axis is z position and the y axis is the prediction value (0 to 1). The blue line is the ground truth, the orange line is the prediction from the model described above. The black line is the random forest Stage 2 model.
\nFor each image level prediction, a random forest model takes as input the prediction and neighbor predictions [1,2,3,4,5,6,7,8,9,10,15,20,25,30,35,40,45,50,60,70,80,90,100,150,200,250] on either side. Then the random forest model predicts a new image level prediction display in black below. Notice when the original prediction is close to 1, then the random forest pushes it up to 1 and when the original prediction is close to 0, then the random forest pushes it down to 0.
\nThis stage 2 image level model increased LB to 0.204 from 0.215 and CV to 0.224 from 0.235 (gain = 0.011)
\n
inp = L.Input(shape=(64, 1792))\nx = L.Bidirectional(L.GRU(48, return_sequences=True, \n kernel_initializer='orthogonal'))(inp)\nx = L.Bidirectional(L.GRU(48, return_sequences=False, \n kernel_initializer='orthogonal'))(x)\nx = L.Dense(9, activation='sigmoid')(x)\n\nmodel = tf.keras.Model(inputs=inp, outputs=x)\nopt = tf.keras.optimizers.Adam(lr=0.00005)\nmodel.compile(loss=weighted_log_loss, optimizer = opt)\nSimilarly we can use adjacent slice information to improve our patient level predictions. Most patients have between 160 and 310 images per study.
\n
Below are plots of the top view (Z position is vertical axis) of the 3D image (not the ordinary slice view of the 3D image). We notice that most of the crucial information is between 25% and 75% in top view. Therefore we extracted 64 images equally spaces between 25% and 75% Z position. Then we took those 64 images and extracted the GAP embeddings from both our stage 1 model one and stage 1 model two. We trained a stage 2 GRU model and a stage 2 1D-CNN model to predict exam level predictions from these 64 GAP embeddings.
\n
This stage 2 exam level model increased LB to 0.183 from 0.204 and CV to 0.203 from 0.224 (gain = 0.021)
\nWhen using global average pooling 2D in your CNN, location information is lost. Therefore I tried giving my models location information in various ways to help predict targets related to location (i.e. leftsided_pe etc) and related to size (i.e. rv_lv_ratio_gte_1 etc). Unfortunately, none of my ideas increased CV or LB. My favorite is below.
I extracted class activation maps from my stage 1 models and feed the location information into stage 2 exam models. (CAMs explained here). In the below figure, the ground truth is in the title. The green circles are the CAM of my EfficientNetB4 model. Note that CT scans are flipped so the left side of the image is \"right\" and the right side of the image is \"left. You can see that the CAM does a good job of locating the PE.
\n
Thank you so much for sharing @cdeotte !! I love your solution discussions! There is so much to learn from them! 💛
\nI was very sad that I was not able to submit a solution because I completely underestimated the performance challenge of this competition. I was so happy to see now that you also used only 30 % of the data (yes! :-)) and windowed images. Why did you use level 40 and width 400? We had the idea to use the \"blood windows\" ranging from 5-60 and 60-160 HU to detect chronic and acute PE and segmented lungs. Why have you used a more broad window instead? How did you use only 1 channel? Aren't 3 channels expected by your model?!
\nIt's great to see how it helped to discover where PE is usually located. That's so elegant! We thought about masking the exam targets for images showing no PE at all but it already felt like \"showing too much\" for solving the exam-level. Now I understand that my problem was that I tried to solve this all with one model instead of splitting the tasks on several different models and stages. I think I was too focused on finding a single solution because of the performance stuff and my little time available. I was also much too cautious to use smaller image sizes and backbones even though I had in mind \"start simple\".
\nThank you again for sharing your ideas and for making it possible to learn and improve!
", "rawMarkdown": "Thank you so much for sharing @cdeotte !! I love your solution discussions! There is so much to learn from them! 💛\n\nI was very sad that I was not able to submit a solution because I completely underestimated the performance challenge of this competition. I was so happy to see now that you also used only 30 % of the data (yes! :-)) and windowed images. Why did you use level 40 and width 400? We had the idea to use the \"blood windows\" ranging from 5-60 and 60-160 HU to detect chronic and acute PE and segmented lungs. Why have you used a more broad window instead? How did you use only 1 channel? Aren't 3 channels expected by your model?!\n\nIt's great to see how it helped to discover where PE is usually located. That's so elegant! We thought about masking the exam targets for images showing no PE at all but it already felt like \"showing too much\" for solving the exam-level. Now I understand that my problem was that I tried to solve this all with one model instead of splitting the tasks on several different models and stages. I think I was too focused on finding a single solution because of the performance stuff and my little time available. I was also much too cautious to use smaller image sizes and backbones even though I had in mind \"start simple\". \n\nThank you again for sharing your ideas and for making it possible to learn and improve!", "votes": 3, "replies": [ { "id": 1062465, "postDate": "2020-10-27T21:21:21.497Z", "content": "Thanks Laura. Using only one \"window\" (1-channel) reduced disk and RAM storage by 66% compared with saving 3 channel images to disk or RAM. (also note that original dicom is uint16, so applying windowing additionally reduces data by 50%). Furthermore, all images are uint8 outside of the model which is 75% less RAM than float32 images. (i.e. don't divide by 255 outside the model).
So, when using 128x128 uint8 1-channel images, all the train data can fit in 8.9GB. (that's 542_769 of the 1_790_594 train images where exam has PE). You don't even need to read from hard drive after putting it all in RAM. The data loader is incredibly fast. I'll say that again, the original 1_000_000_000_000 bytes (1TB) of train data can fit in 8.9GB of memory!
Then the model receives the 1-channel image and converts to 3-channel float32 before inputting into EfficientNet as below
# THIS MODEL TRAINS ON RANDOM 80X80 CROPS FROM 128X128\ninp = tf.keras.Input(shape=(80, 80, 1)) # INPUT IS UINT8\nx = tf.keras.layers.Concatenate()([inp/255., inp/255., inp/255.])\nbase_model = efn.EfficientNetB0(weights='imagenet', include_top=False) \nx = base_model(x)\nI experimented with using different windowing schemes, but nothing increased my CV LB. I even did creative stuff like making 7 channel images where the additional 6 channels were neighboring slices. But again it didn't help. I also did strange stuff like embedding location information into images. For example, put left side of image in Red channel and right side of image in Blue channel but again it didn't help.
", "rawMarkdown": "Thanks Laura. Using only one \"window\" (1-channel) reduced disk and RAM storage by 66% compared with saving 3 channel images to disk or RAM. (also note that original dicom is `uint16`, so applying windowing additionally reduces data by 50%). Furthermore, all images are `uint8` outside of the model which is 75% less RAM than `float32` images. (i.e. don't divide by 255 outside the model).\n\nSo, when using 128x128 `uint8` 1-channel images, all the train data can fit in 8.9GB. (that's 542_769 of the 1_790_594 train images where exam has PE). You don't even need to read from hard drive after putting it all in RAM. The data loader is incredibly fast. I'll say that again, the original 1_000_000_000_000 bytes (1TB) of train data can fit in 8.9GB of memory!\n\nThen the model receives the 1-channel image and converts to 3-channel `float32` before inputting into EfficientNet as below\n\n # THIS MODEL TRAINS ON RANDOM 80X80 CROPS FROM 128X128\n inp = tf.keras.Input(shape=(80, 80, 1)) # INPUT IS UINT8\n x = tf.keras.layers.Concatenate()([inp/255., inp/255., inp/255.])\n base_model = efn.EfficientNetB0(weights='imagenet', include_top=False) \n x = base_model(x)\n\nI experimented with using different windowing schemes, but nothing increased my CV LB. I even did creative stuff like making 7 channel images where the additional 6 channels were neighboring slices. But again it didn't help. I also did strange stuff like embedding location information into images. For example, put left side of image in Red channel and right side of image in Blue channel but again it didn't help.\n\n", "votes": 5 }, { "id": 1074060, "postDate": "2020-11-10T07:38:09.197Z", "content": "Thank you @cdeotte - I am actually trying to replicate the solution on my own machine to learn working with Dicoms.
\nCurrently using the preprocessing script shared by Ian Pan here.
\nAm I right in assuming that you converted dicoms to signle channel PNGs first using (40, 400) mediastinal window and then fed them into the model please? :)
", "rawMarkdown": "Thank you @cdeotte - I am actually trying to replicate the solution on my own machine to learn working with Dicoms. \n\nCurrently using the preprocessing script shared by Ian Pan [here](https://www.kaggle.com/c/rsna-str-pulmonary-embolism-detection/discussion/182930).\n\nAm I right in assuming that you converted dicoms to signle channel PNGs first using (40, 400) mediastinal window and then fed them into the model please? :) " }, { "id": 1074067, "postDate": "2020-11-10T07:44:06.497Z", "content": "Also, any chance you'd be willing your preprocessing script please? Thanks in advance!
", "rawMarkdown": "Also, any chance you'd be willing your preprocessing script please? Thanks in advance!" } ] }, { "id": 1061360, "postDate": "2020-10-27T00:43:47.620Z", "content": "Great work @cdeotte - Impressive solo finish! Cool to see you implemented random forest in your stage 2 model! I wanted to try a tabular model in stacking but we didn't have time. May I ask why you used random forest and not a GBM?
", "rawMarkdown": "Great work @cdeotte - Impressive solo finish! Cool to see you implemented random forest in your stage 2 model! I wanted to try a tabular model in stacking but we didn't have time. May I ask why you used random forest and not a GBM?", "votes": 3, "replies": [ { "id": 1061370, "postDate": "2020-10-27T00:54:16.060Z", "content": "Thanks Rob. Congrats to your team too.
\nIt's my intuition and CV proved it correct. (GBM had lower CV) My stage 2 random forest has 53 features. They are oof and then 26 forward shifts and 26 backward shifts of oof. I wanted all these features to be treated somewhat similar. I didn't want the model searching for signal in specific shifts.
In Ion comp, random forest also did better than GBM for the same reason when using signal and shifted signal. (Random forest overfitted less than GBM).
", "rawMarkdown": "Thanks Rob. Congrats to your team too.\n\nIt's my intuition and CV proved it correct. (GBM had lower CV) My stage 2 random forest has 53 features. They are `oof` and then 26 forward shifts and 26 backward shifts of oof. I wanted all these features to be treated somewhat similar. I didn't want the model searching for signal in specific shifts.\n\nIn Ion comp, random forest also did better than GBM for the same reason when using signal and shifted signal. (Random forest overfitted less than GBM).", "votes": 3 }, { "id": 1061375, "postDate": "2020-10-27T01:02:36.953Z", "content": "Makes sense, thanks for explaining!
", "rawMarkdown": "Makes sense, thanks for explaining!", "votes": 2 }, { "id": 1061379, "postDate": "2020-10-27T01:05:24.947Z", "content": "Interesting! We have had a very similar approach and lgbm worked much better for us. I will give a write up Tomorrow.
", "rawMarkdown": "Interesting! We have had a very similar approach and lgbm worked much better for us. I will give a write up Tomorrow.", "votes": 4 } ] }, { "id": 1082264, "postDate": "2020-11-17T18:38:07.450Z", "content": "Thank you very much for your insights!! I always join your exact explanations and tutorials!
\nCould you explain how you trained your Stage 1 Model with the additional GAP - layer?
\nI always get errors, when training it with two outputs (x, GAP) while having only one target. I tried to Compile with:
\nmodel.compile(
\n optimizer='adam',
\n loss = [tf.keras.losses.BinaryCrossentropy(from_logits=True), None],
\n metrics=['accuracy'])
\n but when training (model.fit(get_training_dataset(), …) I get th error: 'Dimensions must be equal, but are 7 and 1791 for '{{node Equal_1}} '
@jensvannahl We build the stage 1 model with only 1 output and train it with 1 output. After it is done training, you build a second model that has 2 outputs and transfer the trained weights from the first model to the second model. Then use the second model for inference only (i.e. _, GAP = model2.predict(train) )to extract the GAP layer. (We do not train any model that has 2 outputs).
Thank you very much for these insights!!!
\nCould you please explain, how you trained stage 1 Model mit additional output of the GAP-layer?
\nCompiling the
model = Model (model input, [x, GAP]) I used
\nmodel.compile(
\n optimizer='adam',
\n loss = [tf.keras.losses.BinaryCrossentropy(from_logits=True), None],
\n metrics=['accuracy'])
with no problems, but with
\nmodel.fit(get_training_dataset(), …) I always get 'Dimensions must be equal, but are 7 and 1792 for '{{node Equal_1}} = Equal[T=DT_FLOAT, incompatible_shape_error=true](Cast_18, Cast_20)' with input shapes: [?,7], [?,1792].'
", "rawMarkdown": "Thank you very much for these insights!!! \n\nCould you please explain, how you trained stage 1 Model mit additional output of the GAP-layer?\nCompiling the \n\nmodel = Model (model input, [x, GAP]) I used\nmodel.compile(\n optimizer='adam',\n loss = [tf.keras.losses.BinaryCrossentropy(from_logits=True), None],\n metrics=['accuracy'])\n\nwith no problems, but with\n\nmodel.fit(get_training_dataset(), ...) I always get 'Dimensions must be equal, but are 7 and 1792 for '{{node Equal_1}} = Equal[T=DT_FLOAT, incompatible_shape_error=true](Cast_18, Cast_20)' with input shapes: [?,7], [?,1792].'", "votes": 1 }, { "id": 1073690, "postDate": "2020-11-09T20:15:49.650Z", "content": "Thank you @cdeotte and congrats on the finish! I have been following your work since ISIC Melonama and it is always a pleasure to read :)
\nCould I please ask how you trained Stage 1 - Model Two - Patient Level Predictions?
I am a bit confused by:
\n\n\nthen take the 9 average predictions.
\n
Where are these 9 predictions coming from? And what are the labels used to train the model? Sorry if it's a silly question.
", "rawMarkdown": "Thank you @cdeotte and congrats on the finish! I have been following your work since ISIC Melonama and it is always a pleasure to read :) \n\nCould I please ask how you trained `Stage 1 - Model Two - Patient Level Predictions`? \n\nI am a bit confused by: \n> then take the 9 average predictions.\n\nWhere are these 9 predictions coming from? And what are the labels used to train the model? Sorry if it's a silly question.", "votes": 1, "replies": [ { "id": 1073741, "postDate": "2020-11-09T21:59:29.063Z", "content": "Hi Aman. For each patient (i.e. study), I discard all slices that are outside 0.35 < z < 0.65. So for example, if a patient has 100 slices, I sort them in Z order and then discard the first 35 and last 35 slices. I only keep the 30% middle slices from 0.35 < z_normalized < 0.65. I put all the slices I'm keeping from all the patients in X_train_exam.
I then train an EfficientNet using on X_train_exam with an output layer of 9 sigmoid units and weighted log loss (based on the metric weights for each of the 9 exam targets).
Finally for inference, for each patient, I predict the 9 targets for each of a patient's 30% middle slices (i.e. X_test_exam). So if a test dataset patient originally has 100 slices, i will predict for 30 middle slices. I now have 30 predictions for each of the 9 targets. For a specific target such as rv_lv_ratio_gte_1, i will take the average of those 30 predictions and submit that to Kaggle for that patient.
==========
\nUsing the above technique, I could make a submission to Kaggle using only Stage 1 models and achieved LB 0.215. After building a Stage 2 model to predict exam level predictions, I no longer used these Stage 1 predictions in my final submission.
\nFor a while I ensembled my Stage 1 and Stage 2 exam predictions (and that was better than using either alone). But then my Stage 2 model became so accurate that using Stage 1 predictions only made it worse.
", "rawMarkdown": "Hi Aman. For each patient (i.e. study), I discard all slices that are outside `0.35 < z < 0.65`. So for example, if a patient has 100 slices, I sort them in Z order and then discard the first 35 and last 35 slices. I only keep the 30% middle slices from `0.35 < z_normalized < 0.65`. I put all the slices I'm keeping from all the patients in `X_train_exam`.\n\nI then train an EfficientNet using on `X_train_exam` with an output layer of 9 sigmoid units and weighted log loss (based on the metric weights for each of the 9 exam targets).\n\nFinally for inference, for each patient, I predict the 9 targets for each of a patient's 30% middle slices (i.e. `X_test_exam`). So if a test dataset patient originally has 100 slices, i will predict for 30 middle slices. I now have 30 predictions for each of the 9 targets. For a specific target such as `rv_lv_ratio_gte_1`, i will take the average of those 30 predictions and submit that to Kaggle for that patient.\n\n==========\n\nUsing the above technique, I could make a submission to Kaggle using only Stage 1 models and achieved LB 0.215. After building a Stage 2 model to predict exam level predictions, I no longer used these Stage 1 predictions in my final submission. \n\nFor a while I ensembled my Stage 1 and Stage 2 exam predictions (and that was better than using either alone). But then my Stage 2 model became so accurate that using Stage 1 predictions only made it worse.", "votes": 2 }, { "id": 1073973, "postDate": "2020-11-10T05:04:19.190Z", "content": "Thanks so much @cdeotte ! Simple baseline and effective! Thanks again for the great explanation.
", "rawMarkdown": "Thanks so much @cdeotte ! Simple baseline and effective! Thanks again for the great explanation. ", "votes": 1 } ] }, { "id": 1065308, "postDate": "2020-10-31T06:23:26.610Z", "content": "Great job!
", "rawMarkdown": "Great job!", "votes": 1 }, { "id": 1065047, "postDate": "2020-10-30T19:37:06.947Z", "content": "Wow, learnt a lot of new stuff, thanks
", "rawMarkdown": "Wow, learnt a lot of new stuff, thanks", "votes": 1, "replies": [ { "id": 1065230, "postDate": "2020-10-31T04:01:29.907Z", "content": "Thanks Sayid
", "rawMarkdown": "Thanks Sayid" } ] }, { "id": 1063967, "postDate": "2020-10-29T14:46:09.043Z", "content": "Great work @cdeotte.. May be a naive question. the first model the pe_present_on_image has been multiplied by 5.6222. Any reason?.
", "rawMarkdown": "Great work @cdeotte.. May be a naive question. the first model the pe_present_on_image has been multiplied by 5.6222. Any reason?. ", "votes": 1, "replies": [ { "id": 1064081, "postDate": "2020-10-29T17:05:28.097Z", "content": "The factor 5.6222 isn't really needed. Instead I could increase the learning rate by 5.6222 or just train longer.
The point is this. When an NN adjusts the model weights during training, it uses the error gradient multiplied by learning rate multiplied by sample weight. So when you adjust the sample weight you effectively adjust your model's learning rate.
\nIn order to keep the same learning rate that worked before using sample weight, I adjust by 5.6222. The scaling factor 5.6222 = train.shape[0]/train.weight.sum()
The sample weight parameter adds a new training weight to each row of the training data. Notice that if each row had default sample weight = 1, then train.shape[0]/train.weight.sum() = 1 and no adjustment is needed.
I wonder why are you using weights instead of oversampling. Theoretically, wouldn't it be better to feed N different augmented inputs instead of one multiplied by N. I understand it costs more, but if cost is the main concern why training with small lr?
", "rawMarkdown": "I wonder why are you using weights instead of oversampling. Theoretically, wouldn't it be better to feed N different augmented inputs instead of one multiplied by N. I understand it costs more, but if cost is the main concern why training with small lr? ", "votes": 2 }, { "id": 1064130, "postDate": "2020-10-29T18:35:59.940Z", "content": "The metric is more complicated than oversampling. Imagine we have two patients, patient A and patient B. Now say that patient A has 400 slices and patient B has 300 slices. Imagine that patient A has only one slice with pe_present_on_image = 1. Imagine patient B has 150 slices with pe_present_on_image = 1.
According to the competition metic, the weight assoicated with patient A's one slice should be 1/400 and the weight associated to each of patient B's 150 slices should be 150/300 each. Notice that we aren't just making pe_present_on_image = 1 oversampled.
There is a fundamental difference between patient A's one positive slice and patient B's 150 positive slices. The pulmonary embolism in patient A will look different because it is smaller and only on one slice. The embolism in patient B will be larger and cover multiple slices. We need to weight these larger embolisms more. We cannot use oversample and just natively weight all embolisms (i.e. pe_present_on_image = 1) more.
This was a great read.
", "rawMarkdown": "This was a great read.", "votes": 1 }, { "id": 1063536, "postDate": "2020-10-29T03:31:27.337Z", "content": "This is an advanced topic, thanks for sharing your insight
", "rawMarkdown": "This is an advanced topic, thanks for sharing your insight", "votes": 1 }, { "id": 1062940, "postDate": "2020-10-28T10:43:46.453Z", "content": "Your explanations are always very detailed and contain great visuals to even better illustrate your work. Great stuff and thanks for sharing!
", "rawMarkdown": "Your explanations are always very detailed and contain great visuals to even better illustrate your work. Great stuff and thanks for sharing!", "votes": 1 }, { "id": 1062615, "postDate": "2020-10-28T03:21:36.563Z", "content": "Good strategy. I tried the efficient B > 3 give me \"CSV not found\" or timeout. My bad bc I can't control it. Learn more from you.
", "rawMarkdown": "Good strategy. I tried the efficient B > 3 give me \"CSV not found\" or timeout. My bad bc I can't control it. Learn more from you.", "votes": 1 }, { "id": 1062614, "postDate": "2020-10-28T03:14:59.403Z", "content": "Your write-up is a master class in clean code and experimentation. Thanks for sharing.
", "rawMarkdown": "Your write-up is a master class in clean code and experimentation. Thanks for sharing. ", "votes": 1 }, { "id": 1062534, "postDate": "2020-10-28T00:12:57.453Z", "content": "Thanks for sharing your clear and concise solution, @cdeotte!
\nIn the part of Stage 2 model two, you noted that:
\n\n\nThen we took those 64 images and extracted the GAP embeddings from both our stage 1 model one and stage 1 model two.
\n
This might be a beginner's question, but what exactly is the GAP embedding?
", "rawMarkdown": "Thanks for sharing your clear and concise solution, @cdeotte! \n\nIn the part of Stage 2 model two, you noted that: \n\n> Then we took those 64 images and extracted the GAP embeddings from both our stage 1 model one and stage 1 model two.\n\nThis might be a beginner's question, but what exactly is the GAP embedding? ", "votes": 1, "replies": [ { "id": 1062588, "postDate": "2020-10-28T02:32:43.290Z", "content": "GAP embedding stands for output of the global average pooling 2D layer. The model below outputs both the pe_present_on_image prediction and the GAP embedding.
inp = tf.keras.Input(shape=(320, 320, 1))\n x = tf.keras.layers.Concatenate()([inp/255., inp/255., inp/255.])\n base_model = efn.EfficientNetB4(weights='imagenet', include_top=False) \n x = base_model(x)\n GAP = tf.keras.layers.GlobalAveragePooling2D()(x) \n x = tf.keras.layers.Dense(1, activation='sigmoid')(GAP)\n model2 = tf.keras.Model(inputs=inp, outputs=[x, GAP] )\nAfter training the model described in the main discussion post above, we save the weights model.save_weights('model.h5'), then we load these weights into model2 and extract the GAP embeddings as follows
model2.load_weights('model.h5')\n_, GAP = model2.predict(X_train)\nNow GAP is a NumPy array of dimension [ len(X_train), 1792] because EfficientNetB4 has 1792 features in its global average pooling 2D output. If X_train is organized as every 64 rows is one exam, then we reshape GAP with GAP = GAP.reshape((-1,64,1792)). We then train our model_GRU with model_GRU.fit(GAP, targets) where targets has dimension [ len(X_train)/64, 9] and contains the exam targets.
Thanks for a detailed follow up! I finally fully understood what you did on your solution.
", "rawMarkdown": "Thanks for a detailed follow up! I finally fully understood what you did on your solution. ", "votes": 1 } ] }, { "id": 1062448, "postDate": "2020-10-27T20:52:14.383Z", "content": "Good job on your place. Very well deserved!
", "rawMarkdown": "Good job on your place. Very well deserved!", "votes": 1 }, { "id": 1062426, "postDate": "2020-10-27T20:07:50.180Z", "content": "Very good solution and approach ! Best work
", "rawMarkdown": "Very good solution and approach ! Best work ", "votes": 1 }, { "id": 1061695, "postDate": "2020-10-27T08:09:10.417Z", "content": "learned a lot from seeing your solution @cdeotte. now i know where i went wrong in my approaches. next time I am going to spend some more time on experiments with lesser data and smaller model.
", "rawMarkdown": "learned a lot from seeing your solution @cdeotte. now i know where i went wrong in my approaches. next time I am going to spend some more time on experiments with lesser data and smaller model.", "votes": 1, "replies": [ { "id": 1062375, "postDate": "2020-10-27T19:15:00.483Z", "content": "Me too. I had so much frustration trying to train on all the data. So many hours drumming my fingers while the training ran only to find it timeout.
\nNow thanks to Chris I learn the (in retrospect quite obvious though I missed it entirely :) ) lesson to experiment on smaller data and test ideas quickly. Also if I stepped back and thought as Chris did “do I need all of the data” that would have helped a lot.
Kaggle = (Pain + inspiration)*learning
", "rawMarkdown": "Me too. I had so much frustration trying to train on all the data. So many hours drumming my fingers while the training ran only to find it timeout.\nNow thanks to Chris I learn the (in retrospect quite obvious though I missed it entirely :) ) lesson to experiment on smaller data and test ideas quickly. Also if I stepped back and thought as Chris did “do I need all of the data” that would have helped a lot. \n\nKaggle = (Pain + inspiration)*learning ", "votes": 1 }, { "id": 1062401, "postDate": "2020-10-27T19:37:31.540Z", "content": "Good insight. I elaborate further here
", "rawMarkdown": "Good insight. I elaborate further [here][1]\n\n[1]: https://www.kaggle.com/c/rsna-str-pulmonary-embolism-detection/discussion/193598" } ] }, { "id": 1061434, "postDate": "2020-10-27T02:28:01.167Z", "content": "Congrats on results @cdeotte and thanks for sharing the detailed solution !!
", "rawMarkdown": "Congrats on results @cdeotte and thanks for sharing the detailed solution !!", "votes": 1 }, { "id": 1061361, "postDate": "2020-10-27T00:44:49.170Z", "content": "Congrats Chris!
", "rawMarkdown": "Congrats Chris! ", "votes": 1 }, { "id": 1061356, "postDate": "2020-10-27T00:40:14.820Z", "content": "Congrats on results and thanks for the writeup details solution @cdeotte
", "rawMarkdown": "Congrats on results and thanks for the writeup details solution @cdeotte", "votes": 1 }, { "id": 1061669, "postDate": "2020-10-27T07:34:13.450Z", "content": "Congratz on the nice finish Chris !
\nI'm always impressed by your write-ups, they really make your solution stand out, and are pleasant to read.
", "rawMarkdown": "Congratz on the nice finish Chris !\n\nI'm always impressed by your write-ups, they really make your solution stand out, and are pleasant to read.", "votes": 2, "replies": [ { "id": 1062303, "postDate": "2020-10-27T18:10:39.117Z", "content": "Thanks Theo
", "rawMarkdown": "Thanks Theo", "votes": 1 } ] }, { "id": 1061585, "postDate": "2020-10-27T05:36:12.317Z", "content": "Hi @cdeotte . Thank you for the amazing write up. I am impressed by your simple and easy flowing explanation in all the competitions :). Keep Shining.
", "rawMarkdown": "Hi @cdeotte . Thank you for the amazing write up. I am impressed by your simple and easy flowing explanation in all the competitions :). Keep Shining. ", "votes": 2 }, { "id": 1061515, "postDate": "2020-10-27T03:53:44.040Z", "content": "Wow ! Its amazing how you get the time to create and run so many experiments AND document it too !!
\nThank you and congratulations
Congratulations Dr. @cdeotte. You are truly an inspiration for newbies.. Thanks a lot for sharing the amazing concepts that fueled your solution…
", "rawMarkdown": "Congratulations Dr. @cdeotte. You are truly an inspiration for newbies.. Thanks a lot for sharing the amazing concepts that fueled your solution... ", "votes": 2, "replies": [ { "id": 1061432, "postDate": "2020-10-27T02:24:58.567Z", "content": "Thank you Redwan @redwankarimsony . Your notebooks were very helpful. I read all of them and used some of your ideas. Thank you.
", "rawMarkdown": "Thank you Redwan @redwankarimsony . Your notebooks were very helpful. I read all of them and used some of your ideas. Thank you.", "votes": 2 } ] }, { "id": 1061380, "postDate": "2020-10-27T01:06:57.670Z", "content": "Thank you for sharing. Great work @cdeotte . Very informative and I need more time to read.
", "rawMarkdown": "Thank you for sharing. Great work @cdeotte . Very informative and I need more time to read.", "votes": 2 }, { "id": 1061365, "postDate": "2020-10-27T00:49:17.033Z", "content": "You show the power of the NVIDIA device, I decided to buy a Tesla V100 after this competition.
", "rawMarkdown": "You show the power of the NVIDIA device, I decided to buy a Tesla V100 after this competition.", "votes": 2, "replies": [ { "id": 1061373, "postDate": "2020-10-27T00:57:28.197Z", "content": "My wallet hurts from me even reading this comment…
\nwith that said, I just bought a few 2080ti's myself 😂
Maybe TITAN RTX is a better choice, with 24GRAM, is better for training with large batch size.
\nabout 10% expensive than 2080ti?
As a Grand Grand Master of NVIDIA, could you please give us some advice to buy a GPU for Kaggle within 4000$USD? @cdeotte
", "rawMarkdown": "As a Grand Grand Master of NVIDIA, could you please give us some advice to buy a GPU for Kaggle within 4000$USD? @cdeotte ", "votes": 2 }, { "id": 1061452, "postDate": "2020-10-27T02:40:56.263Z", "content": "I haven't compared all the GPUs yet myself. The main difference between the V (professional) series and the RTX (consumer) series is that the V series double checks to prevent computational errors and V series has more VRAM which is very helpful. However for building models (which use random augmentations already), an occasional error may not matter. So perhaps RTX is more bang for your buck. But maybe you will need a few of them so you have enough VRAM.
", "rawMarkdown": "I haven't compared all the GPUs yet myself. The main difference between the V (professional) series and the RTX (consumer) series is that the V series double checks to prevent computational errors and V series has more VRAM which is very helpful. However for building models (which use random augmentations already), an occasional error may not matter. So perhaps RTX is more bang for your buck. But maybe you will need a few of them so you have enough VRAM.", "votes": 3 } ] }, { "id": 1061331, "postDate": "2020-10-27T00:14:09.297Z", "content": "There is alot to learn from @cdeotte Thanks for sharning
", "rawMarkdown": "There is alot to learn from @cdeotte Thanks for sharning", "votes": 2 }, { "id": 1062803, "postDate": "2020-10-28T07:49:49.430Z", "rawMarkdown": "", "votes": 1, "isDeleted": true }, { "id": 1065142, "postDate": "2020-10-30T22:32:10.853Z", "content": "Thanks for sharing !
", "rawMarkdown": "Thanks for sharing !", "votes": 1 }, { "id": 1064056, "postDate": "2020-10-29T16:32:00.303Z", "content": "Thanks for sharing.
", "rawMarkdown": "Thanks for sharing.", "votes": 1 }, { "id": 1063675, "postDate": "2020-10-29T07:47:32.210Z", "content": "This was of great help . Thank You !
", "rawMarkdown": "This was of great help . Thank You !", "votes": 1 }, { "id": 1063009, "postDate": "2020-10-28T12:30:22.323Z", "content": "Thanks for Sharing!!!
", "rawMarkdown": "Thanks for Sharing!!!", "votes": 1 }, { "id": 1064062, "postDate": "2020-10-29T16:43:14.883Z", "content": "Thanks for sharing!!
", "rawMarkdown": "Thanks for sharing!!", "votes": 2 } ], "comments": [ { "id": 1062454, "author_name": "Laura Fink", "author_url": "", "post_date": "2020-10-27T21:00:52.477000", "content": "Thank you so much for sharing @cdeotte !! I love your solution discussions! There is so much to learn from them! 💛
\nI was very sad that I was not able to submit a solution because I completely underestimated the performance challenge of this competition. I was so happy to see now that you also used only 30 % of the data (yes! :-)) and windowed images. Why did you use level 40 and width 400? We had the idea to use the \"blood windows\" ranging from 5-60 and 60-160 HU to detect chronic and acute PE and segmented lungs. Why have you used a more broad window instead? How did you use only 1 channel? Aren't 3 channels expected by your model?!
\nIt's great to see how it helped to discover where PE is usually located. That's so elegant! We thought about masking the exam targets for images showing no PE at all but it already felt like \"showing too much\" for solving the exam-level. Now I understand that my problem was that I tried to solve this all with one model instead of splitting the tasks on several different models and stages. I think I was too focused on finding a single solution because of the performance stuff and my little time available. I was also much too cautious to use smaller image sizes and backbones even though I had in mind \"start simple\".
\nThank you again for sharing your ideas and for making it possible to learn and improve!
", "votes": 3, "replies": [ { "id": 1062465, "author_name": "Chris Deotte", "author_url": "", "post_date": "2020-10-27T21:21:21.497000", "content": "Thanks Laura. Using only one \"window\" (1-channel) reduced disk and RAM storage by 66% compared with saving 3 channel images to disk or RAM. (also note that original dicom is uint16, so applying windowing additionally reduces data by 50%). Furthermore, all images are uint8 outside of the model which is 75% less RAM than float32 images. (i.e. don't divide by 255 outside the model).
So, when using 128x128 uint8 1-channel images, all the train data can fit in 8.9GB. (that's 542_769 of the 1_790_594 train images where exam has PE). You don't even need to read from hard drive after putting it all in RAM. The data loader is incredibly fast. I'll say that again, the original 1_000_000_000_000 bytes (1TB) of train data can fit in 8.9GB of memory!
Then the model receives the 1-channel image and converts to 3-channel float32 before inputting into EfficientNet as below
# THIS MODEL TRAINS ON RANDOM 80X80 CROPS FROM 128X128\ninp = tf.keras.Input(shape=(80, 80, 1)) # INPUT IS UINT8\nx = tf.keras.layers.Concatenate()([inp/255., inp/255., inp/255.])\nbase_model = efn.EfficientNetB0(weights='imagenet', include_top=False) \nx = base_model(x)\nI experimented with using different windowing schemes, but nothing increased my CV LB. I even did creative stuff like making 7 channel images where the additional 6 channels were neighboring slices. But again it didn't help. I also did strange stuff like embedding location information into images. For example, put left side of image in Red channel and right side of image in Blue channel but again it didn't help.
", "votes": 5, "replies": [] }, { "id": 1074060, "author_name": "Aman Arora", "author_url": "", "post_date": "2020-11-10T07:38:09.197000", "content": "Thank you @cdeotte - I am actually trying to replicate the solution on my own machine to learn working with Dicoms.
\nCurrently using the preprocessing script shared by Ian Pan here.
\nAm I right in assuming that you converted dicoms to signle channel PNGs first using (40, 400) mediastinal window and then fed them into the model please? :)
", "votes": 0, "replies": [] }, { "id": 1074067, "author_name": "Aman Arora", "author_url": "", "post_date": "2020-11-10T07:44:06.497000", "content": "Also, any chance you'd be willing your preprocessing script please? Thanks in advance!
", "votes": 0, "replies": [] } ] }, { "id": 1061360, "author_name": "Rob Mulla", "author_url": "", "post_date": "2020-10-27T00:43:47.620000", "content": "Great work @cdeotte - Impressive solo finish! Cool to see you implemented random forest in your stage 2 model! I wanted to try a tabular model in stacking but we didn't have time. May I ask why you used random forest and not a GBM?
", "votes": 3, "replies": [ { "id": 1061370, "author_name": "Chris Deotte", "author_url": "", "post_date": "2020-10-27T00:54:16.060000", "content": "Thanks Rob. Congrats to your team too.
\nIt's my intuition and CV proved it correct. (GBM had lower CV) My stage 2 random forest has 53 features. They are oof and then 26 forward shifts and 26 backward shifts of oof. I wanted all these features to be treated somewhat similar. I didn't want the model searching for signal in specific shifts.
In Ion comp, random forest also did better than GBM for the same reason when using signal and shifted signal. (Random forest overfitted less than GBM).
", "votes": 3, "replies": [] }, { "id": 1061375, "author_name": "Rob Mulla", "author_url": "", "post_date": "2020-10-27T01:02:36.953000", "content": "Makes sense, thanks for explaining!
", "votes": 2, "replies": [] }, { "id": 1061379, "author_name": "Jan Bre", "author_url": "", "post_date": "2020-10-27T01:05:24.947000", "content": "Interesting! We have had a very similar approach and lgbm worked much better for us. I will give a write up Tomorrow.
", "votes": 4, "replies": [] } ] }, { "id": 1082264, "author_name": "Jens van Nahl", "author_url": "", "post_date": "2020-11-17T18:38:07.450000", "content": "Thank you very much for your insights!! I always join your exact explanations and tutorials!
\nCould you explain how you trained your Stage 1 Model with the additional GAP - layer?
\nI always get errors, when training it with two outputs (x, GAP) while having only one target. I tried to Compile with:
\nmodel.compile(
\n optimizer='adam',
\n loss = [tf.keras.losses.BinaryCrossentropy(from_logits=True), None],
\n metrics=['accuracy'])
\n but when training (model.fit(get_training_dataset(), …) I get th error: 'Dimensions must be equal, but are 7 and 1791 for '{{node Equal_1}} '
@jensvannahl We build the stage 1 model with only 1 output and train it with 1 output. After it is done training, you build a second model that has 2 outputs and transfer the trained weights from the first model to the second model. Then use the second model for inference only (i.e. _, GAP = model2.predict(train) )to extract the GAP layer. (We do not train any model that has 2 outputs).
Thank you very much for these insights!!!
\nCould you please explain, how you trained stage 1 Model mit additional output of the GAP-layer?
\nCompiling the
model = Model (model input, [x, GAP]) I used
\nmodel.compile(
\n optimizer='adam',
\n loss = [tf.keras.losses.BinaryCrossentropy(from_logits=True), None],
\n metrics=['accuracy'])
with no problems, but with
\nmodel.fit(get_training_dataset(), …) I always get 'Dimensions must be equal, but are 7 and 1792 for '{{node Equal_1}} = Equal[T=DT_FLOAT, incompatible_shape_error=true](Cast_18, Cast_20)' with input shapes: [?,7], [?,1792].'
", "votes": 1, "replies": [] }, { "id": 1073690, "author_name": "Aman Arora", "author_url": "", "post_date": "2020-11-09T20:15:49.650000", "content": "Thank you @cdeotte and congrats on the finish! I have been following your work since ISIC Melonama and it is always a pleasure to read :)
\nCould I please ask how you trained Stage 1 - Model Two - Patient Level Predictions?
I am a bit confused by:
\n\n\nthen take the 9 average predictions.
\n
Where are these 9 predictions coming from? And what are the labels used to train the model? Sorry if it's a silly question.
", "votes": 1, "replies": [ { "id": 1073741, "author_name": "Chris Deotte", "author_url": "", "post_date": "2020-11-09T21:59:29.063000", "content": "Hi Aman. For each patient (i.e. study), I discard all slices that are outside 0.35 < z < 0.65. So for example, if a patient has 100 slices, I sort them in Z order and then discard the first 35 and last 35 slices. I only keep the 30% middle slices from 0.35 < z_normalized < 0.65. I put all the slices I'm keeping from all the patients in X_train_exam.
I then train an EfficientNet using on X_train_exam with an output layer of 9 sigmoid units and weighted log loss (based on the metric weights for each of the 9 exam targets).
Finally for inference, for each patient, I predict the 9 targets for each of a patient's 30% middle slices (i.e. X_test_exam). So if a test dataset patient originally has 100 slices, i will predict for 30 middle slices. I now have 30 predictions for each of the 9 targets. For a specific target such as rv_lv_ratio_gte_1, i will take the average of those 30 predictions and submit that to Kaggle for that patient.
==========
\nUsing the above technique, I could make a submission to Kaggle using only Stage 1 models and achieved LB 0.215. After building a Stage 2 model to predict exam level predictions, I no longer used these Stage 1 predictions in my final submission.
\nFor a while I ensembled my Stage 1 and Stage 2 exam predictions (and that was better than using either alone). But then my Stage 2 model became so accurate that using Stage 1 predictions only made it worse.
", "votes": 2, "replies": [] }, { "id": 1073973, "author_name": "Aman Arora", "author_url": "", "post_date": "2020-11-10T05:04:19.190000", "content": "Thanks so much @cdeotte ! Simple baseline and effective! Thanks again for the great explanation.
", "votes": 1, "replies": [] } ] }, { "id": 1065308, "author_name": "Dhruv Anurag", "author_url": "", "post_date": "2020-10-31T06:23:26.610000", "content": "Great job!
", "votes": 1, "replies": [] }, { "id": 1065047, "author_name": "Sayid Khan", "author_url": "", "post_date": "2020-10-30T19:37:06.947000", "content": "Wow, learnt a lot of new stuff, thanks
", "votes": 1, "replies": [ { "id": 1065230, "author_name": "Chris Deotte", "author_url": "", "post_date": "2020-10-31T04:01:29.907000", "content": "Thanks Sayid
", "votes": 0, "replies": [] } ] }, { "id": 1063967, "author_name": "Manoj Prabhakar", "author_url": "", "post_date": "2020-10-29T14:46:09.043000", "content": "Great work @cdeotte.. May be a naive question. the first model the pe_present_on_image has been multiplied by 5.6222. Any reason?.
", "votes": 1, "replies": [ { "id": 1064081, "author_name": "Chris Deotte", "author_url": "", "post_date": "2020-10-29T17:05:28.097000", "content": "The factor 5.6222 isn't really needed. Instead I could increase the learning rate by 5.6222 or just train longer.
The point is this. When an NN adjusts the model weights during training, it uses the error gradient multiplied by learning rate multiplied by sample weight. So when you adjust the sample weight you effectively adjust your model's learning rate.
\nIn order to keep the same learning rate that worked before using sample weight, I adjust by 5.6222. The scaling factor 5.6222 = train.shape[0]/train.weight.sum()
The sample weight parameter adds a new training weight to each row of the training data. Notice that if each row had default sample weight = 1, then train.shape[0]/train.weight.sum() = 1 and no adjustment is needed.
I wonder why are you using weights instead of oversampling. Theoretically, wouldn't it be better to feed N different augmented inputs instead of one multiplied by N. I understand it costs more, but if cost is the main concern why training with small lr?
", "votes": 2, "replies": [] }, { "id": 1064130, "author_name": "Chris Deotte", "author_url": "", "post_date": "2020-10-29T18:35:59.940000", "content": "The metric is more complicated than oversampling. Imagine we have two patients, patient A and patient B. Now say that patient A has 400 slices and patient B has 300 slices. Imagine that patient A has only one slice with pe_present_on_image = 1. Imagine patient B has 150 slices with pe_present_on_image = 1.
According to the competition metic, the weight assoicated with patient A's one slice should be 1/400 and the weight associated to each of patient B's 150 slices should be 150/300 each. Notice that we aren't just making pe_present_on_image = 1 oversampled.
There is a fundamental difference between patient A's one positive slice and patient B's 150 positive slices. The pulmonary embolism in patient A will look different because it is smaller and only on one slice. The embolism in patient B will be larger and cover multiple slices. We need to weight these larger embolisms more. We cannot use oversample and just natively weight all embolisms (i.e. pe_present_on_image = 1) more.
This was a great read.
", "votes": 1, "replies": [] }, { "id": 1063536, "author_name": "Prakhar", "author_url": "", "post_date": "2020-10-29T03:31:27.337000", "content": "This is an advanced topic, thanks for sharing your insight
", "votes": 1, "replies": [] }, { "id": 1062940, "author_name": "Manch Hui", "author_url": "", "post_date": "2020-10-28T10:43:46.453000", "content": "Your explanations are always very detailed and contain great visuals to even better illustrate your work. Great stuff and thanks for sharing!
", "votes": 1, "replies": [] }, { "id": 1062615, "author_name": "( ͡° ͜ʖ ͡°)", "author_url": "", "post_date": "2020-10-28T03:21:36.563000", "content": "Good strategy. I tried the efficient B > 3 give me \"CSV not found\" or timeout. My bad bc I can't control it. Learn more from you.
", "votes": 1, "replies": [] }, { "id": 1062614, "author_name": "Ronaldo S.A. Batista", "author_url": "", "post_date": "2020-10-28T03:14:59.403000", "content": "Your write-up is a master class in clean code and experimentation. Thanks for sharing.
", "votes": 1, "replies": [] }, { "id": 1062534, "author_name": "lr", "author_url": "", "post_date": "2020-10-28T00:12:57.453000", "content": "Thanks for sharing your clear and concise solution, @cdeotte!
\nIn the part of Stage 2 model two, you noted that:
\n\n\nThen we took those 64 images and extracted the GAP embeddings from both our stage 1 model one and stage 1 model two.
\n
This might be a beginner's question, but what exactly is the GAP embedding?
", "votes": 1, "replies": [ { "id": 1062588, "author_name": "Chris Deotte", "author_url": "", "post_date": "2020-10-28T02:32:43.290000", "content": "GAP embedding stands for output of the global average pooling 2D layer. The model below outputs both the pe_present_on_image prediction and the GAP embedding.
inp = tf.keras.Input(shape=(320, 320, 1))\n x = tf.keras.layers.Concatenate()([inp/255., inp/255., inp/255.])\n base_model = efn.EfficientNetB4(weights='imagenet', include_top=False) \n x = base_model(x)\n GAP = tf.keras.layers.GlobalAveragePooling2D()(x) \n x = tf.keras.layers.Dense(1, activation='sigmoid')(GAP)\n model2 = tf.keras.Model(inputs=inp, outputs=[x, GAP] )\nAfter training the model described in the main discussion post above, we save the weights model.save_weights('model.h5'), then we load these weights into model2 and extract the GAP embeddings as follows
model2.load_weights('model.h5')\n_, GAP = model2.predict(X_train)\nNow GAP is a NumPy array of dimension [ len(X_train), 1792] because EfficientNetB4 has 1792 features in its global average pooling 2D output. If X_train is organized as every 64 rows is one exam, then we reshape GAP with GAP = GAP.reshape((-1,64,1792)). We then train our model_GRU with model_GRU.fit(GAP, targets) where targets has dimension [ len(X_train)/64, 9] and contains the exam targets.
Thanks for a detailed follow up! I finally fully understood what you did on your solution.
", "votes": 1, "replies": [] } ] }, { "id": 1062448, "author_name": "Brenda N", "author_url": "", "post_date": "2020-10-27T20:52:14.383000", "content": "Good job on your place. Very well deserved!
", "votes": 1, "replies": [] }, { "id": 1062426, "author_name": "Varun Barath", "author_url": "", "post_date": "2020-10-27T20:07:50.180000", "content": "Very good solution and approach ! Best work
", "votes": 1, "replies": [] }, { "id": 1061695, "author_name": "yuvaramsingh", "author_url": "", "post_date": "2020-10-27T08:09:10.417000", "content": "learned a lot from seeing your solution @cdeotte. now i know where i went wrong in my approaches. next time I am going to spend some more time on experiments with lesser data and smaller model.
", "votes": 1, "replies": [ { "id": 1062375, "author_name": "Mark P", "author_url": "", "post_date": "2020-10-27T19:15:00.483000", "content": "Me too. I had so much frustration trying to train on all the data. So many hours drumming my fingers while the training ran only to find it timeout.
\nNow thanks to Chris I learn the (in retrospect quite obvious though I missed it entirely :) ) lesson to experiment on smaller data and test ideas quickly. Also if I stepped back and thought as Chris did “do I need all of the data” that would have helped a lot.
Kaggle = (Pain + inspiration)*learning
", "votes": 1, "replies": [] }, { "id": 1062401, "author_name": "Chris Deotte", "author_url": "", "post_date": "2020-10-27T19:37:31.540000", "content": "Good insight. I elaborate further here
", "votes": 0, "replies": [] } ] }, { "id": 1061434, "author_name": "Kamal Das", "author_url": "", "post_date": "2020-10-27T02:28:01.167000", "content": "Congrats on results @cdeotte and thanks for sharing the detailed solution !!
", "votes": 1, "replies": [] }, { "id": 1061361, "author_name": "sin", "author_url": "", "post_date": "2020-10-27T00:44:49.170000", "content": "Congrats Chris!
", "votes": 1, "replies": [] }, { "id": 1061356, "author_name": "KhanhVD", "author_url": "", "post_date": "2020-10-27T00:40:14.820000", "content": "Congrats on results and thanks for the writeup details solution @cdeotte
", "votes": 1, "replies": [] }, { "id": 1061669, "author_name": "Theo Viel", "author_url": "", "post_date": "2020-10-27T07:34:13.450000", "content": "Congratz on the nice finish Chris !
\nI'm always impressed by your write-ups, they really make your solution stand out, and are pleasant to read.
", "votes": 2, "replies": [ { "id": 1062303, "author_name": "Chris Deotte", "author_url": "", "post_date": "2020-10-27T18:10:39.117000", "content": "Thanks Theo
", "votes": 1, "replies": [] } ] }, { "id": 1061585, "author_name": "JamshaidSohail", "author_url": "", "post_date": "2020-10-27T05:36:12.317000", "content": "Hi @cdeotte . Thank you for the amazing write up. I am impressed by your simple and easy flowing explanation in all the competitions :). Keep Shining.
", "votes": 2, "replies": [] }, { "id": 1061515, "author_name": "Vee", "author_url": "", "post_date": "2020-10-27T03:53:44.040000", "content": "Wow ! Its amazing how you get the time to create and run so many experiments AND document it too !!
\nThank you and congratulations
Congratulations Dr. @cdeotte. You are truly an inspiration for newbies.. Thanks a lot for sharing the amazing concepts that fueled your solution…
", "votes": 2, "replies": [ { "id": 1061432, "author_name": "Chris Deotte", "author_url": "", "post_date": "2020-10-27T02:24:58.567000", "content": "Thank you Redwan @redwankarimsony . Your notebooks were very helpful. I read all of them and used some of your ideas. Thank you.
", "votes": 2, "replies": [] } ] }, { "id": 1061380, "author_name": "Johnny Lee", "author_url": "", "post_date": "2020-10-27T01:06:57.670000", "content": "Thank you for sharing. Great work @cdeotte . Very informative and I need more time to read.
", "votes": 2, "replies": [] }, { "id": 1061365, "author_name": "Dewei Chen", "author_url": "", "post_date": "2020-10-27T00:49:17.033000", "content": "You show the power of the NVIDIA device, I decided to buy a Tesla V100 after this competition.
", "votes": 2, "replies": [ { "id": 1061373, "author_name": "Stanley Zheng", "author_url": "", "post_date": "2020-10-27T00:57:28.197000", "content": "My wallet hurts from me even reading this comment…
\nwith that said, I just bought a few 2080ti's myself 😂
Maybe TITAN RTX is a better choice, with 24GRAM, is better for training with large batch size.
\nabout 10% expensive than 2080ti?
As a Grand Grand Master of NVIDIA, could you please give us some advice to buy a GPU for Kaggle within 4000$USD? @cdeotte
", "votes": 2, "replies": [] }, { "id": 1061452, "author_name": "Chris Deotte", "author_url": "", "post_date": "2020-10-27T02:40:56.263000", "content": "I haven't compared all the GPUs yet myself. The main difference between the V (professional) series and the RTX (consumer) series is that the V series double checks to prevent computational errors and V series has more VRAM which is very helpful. However for building models (which use random augmentations already), an occasional error may not matter. So perhaps RTX is more bang for your buck. But maybe you will need a few of them so you have enough VRAM.
", "votes": 3, "replies": [] } ] }, { "id": 1061331, "author_name": "Saurabh dubey", "author_url": "", "post_date": "2020-10-27T00:14:09.297000", "content": "There is alot to learn from @cdeotte Thanks for sharning
", "votes": 2, "replies": [] }, { "id": 1062803, "author_name": "", "author_url": "", "post_date": "2020-10-28T07:49:49.430000", "content": "", "votes": 1, "replies": [] }, { "id": 1065142, "author_name": "Camilo", "author_url": "", "post_date": "2020-10-30T22:32:10.853000", "content": "Thanks for sharing !
", "votes": 1, "replies": [] }, { "id": 1064056, "author_name": "", "author_url": "", "post_date": "2020-10-29T16:32:00.303000", "content": "", "votes": 1, "replies": [] }, { "id": 1063675, "author_name": "", "author_url": "", "post_date": "2020-10-29T07:47:32.210000", "content": "", "votes": 1, "replies": [] }, { "id": 1063009, "author_name": "", "author_url": "", "post_date": "2020-10-28T12:30:22.323000", "content": "", "votes": 1, "replies": [] }, { "id": 1064062, "author_name": "", "author_url": "", "post_date": "2020-10-29T16:43:14.883000", "content": "", "votes": 2, "replies": [] } ], "raw_markdown_by_id": { "1061327": "Thank you Radiological Society of North America (RSNA®), Society of Thoracic Radiology (STR), and Kaggle for hosting this fun competition. Thank you Nvidia for providing compute resources.\n\nThis has been one of my favorite competitions. I enjoyed building an elaborate multi-stage pipeline of stacked models! Working with 3D images was fun and provided an additional challenge compared with 2D images. I particularly enjoyed tackling the challenge of building a fast experimentation pipeline when the training data is `1_000_000_000_000 bytes` of data! One trillion bytes! This is the largest dataset I have ever worked with.\n\n# RSNA STR Pulmonary Embolism Detection\nIn the figure below, each row is an exam (i.e. study, i.e. single patient). The row of images are CT scan \"slices\" from the 3D image of a patient's chest. In this competition, we need to predict 9 targets for each patient (each row) (like is pe on left side? on right side? etc) and we need to classify every image (is pe present?). If below were all the data, then we would need to predict `3 rows * 9 targets = 27 exam targets` and `15 images * 1 target = 15 image targets`. In total we would need to predict 42 targets.\n\n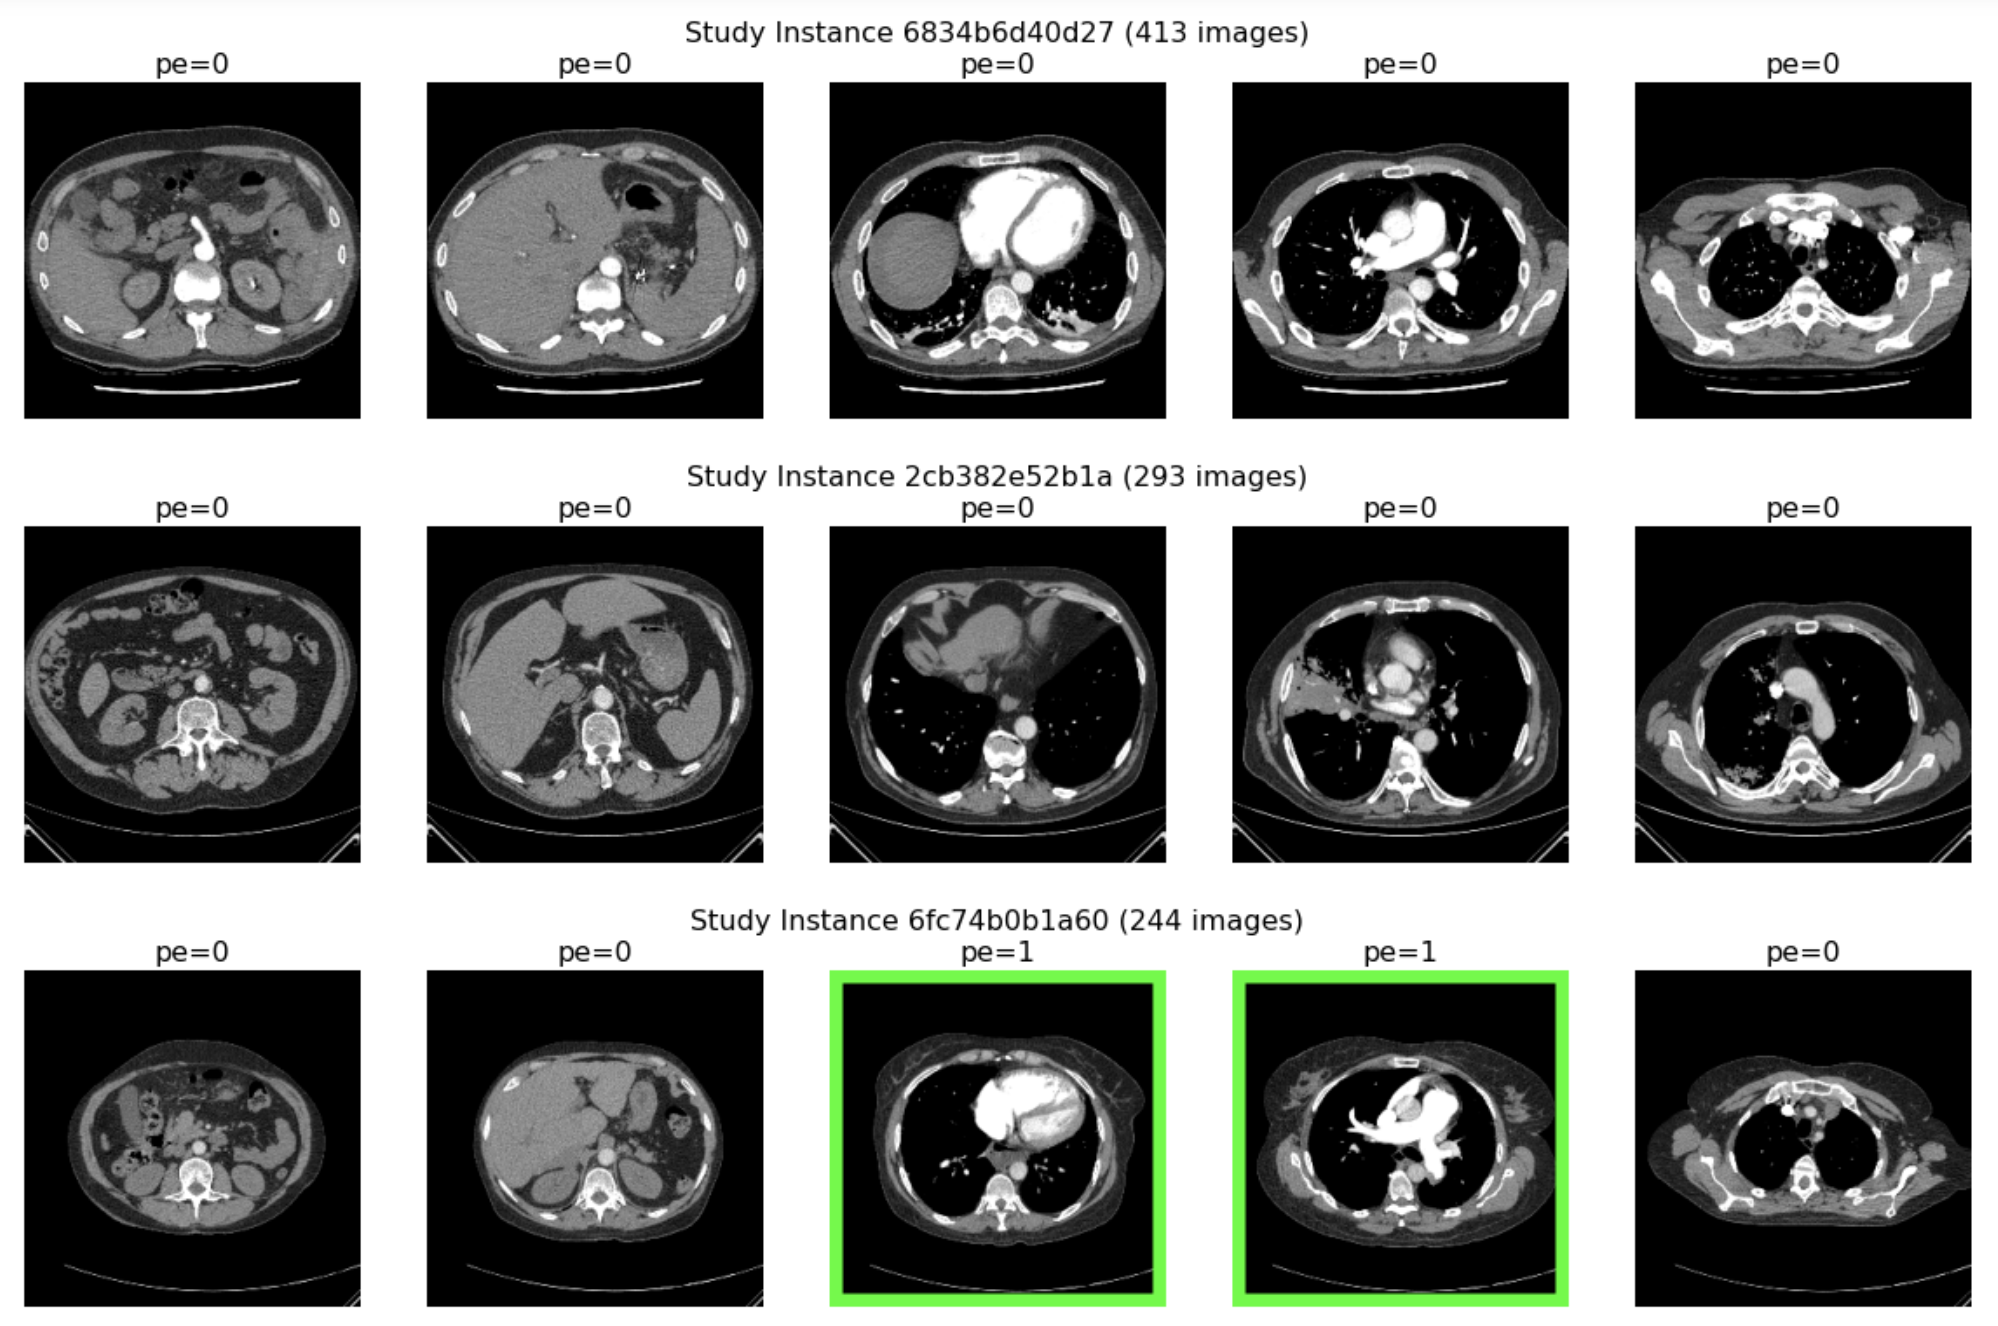\n\n# Understanding the Metric\nOn the description page, the metric seems very confusing. However it is just a weighted average of 10 log losses (the 9 types of exam predictions and the 1 type of image prediction). (I explain the metric [here][2]). After computing the 10 weights, we find that 50% of our LB score is from the 9 exam predictions and 50% of our LB score is from the image predictions. Furthermore, the log loss for the image predictions is itself a weighted log loss where an image that is part of an exam without pulmonary embolism has weight zero (very important observation!) \n\n* Improving image level predictions is equally important as improving exam predictions.\n* There is no penalty for false positives, so we can train our image prediction models with only the 30% of the data from positive exams!\n\n# Stage 1 - Model One - Image Level Predictions\n# (CNN EfficientNet B4)\n\n inp = tf.keras.Input(shape=(320, 320, 1)) # INPUT IS UINT8\n x = tf.keras.layers.Concatenate()([inp/255., inp/255., inp/255.])\n base_model = efn.EfficientNetB4(weights='imagenet', include_top=False) \n\n x = base_model(x)\n x = tf.keras.layers.GlobalAveragePooling2D()(x) \n x = tf.keras.layers.Dense(1, activation='sigmoid')(x)\n \n model = tf.keras.Model(inputs=inp, outputs=x)\n opt = tf.keras.optimizers.Adam(lr=0.000005)\n model.compile(loss='binary_crossentropy', optimizer = opt)\n\n model.fit(X, y, sample_weight = X.groupby('StudyInstanceUID') \n .pe_present_on_image.transform('mean') * 5.6222 )\n\nI built two models. Model one predicts image level predictions (i.e. `pe_present_on_image`) and model two predicts patient level predictions (i.e. exams i.e. studies, like `leftsided_pe` etc)\n* EfficientNet B4 pretrained on `imagenet`\n* **Only Mediastinal window, (ie. level=40, width=400)** i.e. 1 channel `uint8`\n* Random crops of 320x320 from 512x512\n* Rotation (+-8 deg) Scale (+-0.16) augmentation\n* Coarse Dropout (16 holes sized 50x50)\n* Mixup (swap slices of similar Z position with other exams)\n* Adam optimizer with constant `LR = 5e-6`\n* Training sample weight equal to pe proportion in exam\n* **Only train on 30% of train data with pe present in exam**\n* 40 minute epochs using 4x V100 GPU\n* Train 15 epochs with batch size 128\n\nBelow illustrates my augmentations. For display purposes, we illustrate Mixup with a large yellow, green, or blue square so you can see it better. (During runtime, it was an actual second image).\n\n \n\n# Stage 1 - Model Two - Patient Level Predictions\n# (CNN EfficientNet B4)\nEach patient has an average of 200 images. Among those 200, if PE is present, it is usually on the middle slices. Therefore I only train my patient level model with slices `0.35 < z < 0.65`. Then to predict the 9 targets for each patient, I only infer `0.35 < z < 0.65` and then take the 9 average predictions.\n\n* Most details same as model one\n* **Only Mediastinal window, (ie. level=40, width=400)** i.e. 1 channel `uint8`\n* Output layer of 9 sigmoid units\n* **Only train on 30% of train data with Z Position between `0.35 < z < 0.65`**\n* Loss `weighted_log_loss`\n\n\n\n# Experimentation Pipeline\nHow do we discover the details above? All the settings above were discovered by performing dozens of experiments on **smaller images and smaller backbones**. For example, use 128x128 (with 80x80 crops) EfficientNetB0 and/or 256x256 (with 160x160 crops) EfficientNetB2. Using these smaller models, we can test out ideas on a single GPU in minutes! Also note that we only use 1 channel images of `uint8`. This is 33% less data than converting images to 3 channels of 3 different CT window schemes.\n\n\n\nRemember we are only training with 30% original data. Then using crops makes it 12% of data. Then using 256x256 reduces this to 3% of data. And using 128x128 reduces this to 0.75% of data! Even Kaggle notebooks P100 GPU can train quickly on 80x80 crops from 128x128 and 30% train data.\n\nOnce you find a configuration that works well, then run 512x512 with EfficientNetB4 overnight. Using only 2D predictions for image and 2D predictions for patient, **the above two models obtain LB 0.215 and CV 0.235.** \n\nWe will now increase our CV LB by building stage 2 models that use stage 1 predictions as input\n \n# Stage 2 - Model One - Image Level Predictions\n# (Random Forest)\n\n FEATURES = ['oof']\n for k in NEIGHBORS:\n tmp = train.sort_values('PosZ').groupby('StudyInstanceUID')[['oof']]\n train['b%i'%k] = tmp.shift(k)\n train['a%i'%k] = tmp.shift(-k)\n FEATURES += ['a%i'%k, 'b%i'%k]\n train.fillna(-1,inplace=True)\n\n model = RandomForestClassifier(max_depth=9, n_estimators=100, \n n_jobs=20, min_samples_leaf=50)\n model.fit(train.loc[idxT,FEATURES],train.loc[idxT,'pe_present_on_image'],\n sample_weight = 5.6222 * valid.loc[idxT,'weight'])\n\nAll images are slices from 3D images. So adjacent images (within the same exam) contain helpful information. Each plot below displays all 200 or so image level predictions from 1 study. The x axis is z position and the y axis is the prediction value (0 to 1). The blue line is the ground truth, the orange line is the prediction from the model described above. The black line is the random forest Stage 2 model.\n\nFor each image level prediction, a random forest model takes as input the prediction and neighbor predictions [1,2,3,4,5,6,7,8,9,10,15,20,25,30,35,40,45,50,60,70,80,90,100,150,200,250] on either side. Then the random forest model predicts a new image level prediction display in black below. Notice when the original prediction is close to 1, then the random forest pushes it up to 1 and when the original prediction is close to 0, then the random forest pushes it down to 0.\n\n**This stage 2 image level model increased LB to 0.204 from 0.215 and CV to 0.224 from 0.235 (gain = 0.011)**\n\n\n\n# Stage 2 - Model Two - Patient Level Predictions\n# (GRU + 1D-CNN)\n\n inp = L.Input(shape=(64, 1792))\n x = L.Bidirectional(L.GRU(48, return_sequences=True, \n kernel_initializer='orthogonal'))(inp)\n x = L.Bidirectional(L.GRU(48, return_sequences=False, \n kernel_initializer='orthogonal'))(x)\n x = L.Dense(9, activation='sigmoid')(x)\n \n model = tf.keras.Model(inputs=inp, outputs=x)\n opt = tf.keras.optimizers.Adam(lr=0.00005)\n model.compile(loss=weighted_log_loss, optimizer = opt)\n\nSimilarly we can use adjacent slice information to improve our patient level predictions. Most patients have between 160 and 310 images per study.\n\n\n\nBelow are plots of the top view (Z position is vertical axis) of the 3D image (not the ordinary slice view of the 3D image). We notice that most of the crucial information is between 25% and 75% in top view. Therefore we extracted 64 images equally spaces between 25% and 75% Z position. Then we took those 64 images and extracted the GAP embeddings from both our stage 1 model one and stage 1 model two. We trained a stage 2 GRU model and a stage 2 1D-CNN model to predict exam level predictions from these 64 GAP embeddings.\n\n\n\n**This stage 2 exam level model increased LB to 0.183 from 0.204 and CV to 0.203 from 0.224 (gain = 0.021)**\n\n# Other Misc Ideas\nWhen using global average pooling 2D in your CNN, location information is lost. Therefore I tried giving my models location information in various ways to help predict targets related to location (i.e. `leftsided_pe` etc) and related to size (i.e. `rv_lv_ratio_gte_1` etc). Unfortunately, none of my ideas increased CV or LB. My favorite is below.\n\n## Locating PE with Class Activation Maps CAM\n\nI extracted class activation maps from my stage 1 models and feed the location information into stage 2 exam models. (CAMs explained [here][1]). In the below figure, the ground truth is in the title. The green circles are the CAM of my EfficientNetB4 model. Note that CT scans are flipped so the left side of the image is \"right\" and the right side of the image is \"left. You can see that the CAM does a good job of locating the PE.\n\n\n\n# Thank you\n\n[1]: https://www.kaggle.com/cdeotte/unsupervised-masks-cv-0-60\n[2]: https://www.kaggle.com/c/rsna-str-pulmonary-embolism-detection/discussion/193598", "1062454": "Thank you so much for sharing @cdeotte !! I love your solution discussions! There is so much to learn from them! 💛\n\nI was very sad that I was not able to submit a solution because I completely underestimated the performance challenge of this competition. I was so happy to see now that you also used only 30 % of the data (yes! :-)) and windowed images. Why did you use level 40 and width 400? We had the idea to use the \"blood windows\" ranging from 5-60 and 60-160 HU to detect chronic and acute PE and segmented lungs. Why have you used a more broad window instead? How did you use only 1 channel? Aren't 3 channels expected by your model?!\n\nIt's great to see how it helped to discover where PE is usually located. That's so elegant! We thought about masking the exam targets for images showing no PE at all but it already felt like \"showing too much\" for solving the exam-level. Now I understand that my problem was that I tried to solve this all with one model instead of splitting the tasks on several different models and stages. I think I was too focused on finding a single solution because of the performance stuff and my little time available. I was also much too cautious to use smaller image sizes and backbones even though I had in mind \"start simple\". \n\nThank you again for sharing your ideas and for making it possible to learn and improve!", "1061360": "Great work @cdeotte - Impressive solo finish! Cool to see you implemented random forest in your stage 2 model! I wanted to try a tabular model in stacking but we didn't have time. May I ask why you used random forest and not a GBM?", "1082264": "Thank you very much for your insights!! I always join your exact explanations and tutorials!\n\nCould you explain how you trained your Stage 1 Model with the additional GAP - layer?\n\nI always get errors, when training it with two outputs (x, GAP) while having only one target. I tried to Compile with:\n\nmodel.compile(\n optimizer='adam',\n loss = [tf.keras.losses.BinaryCrossentropy(from_logits=True), None],\n metrics=['accuracy']) \n but when training (model.fit(get_training_dataset(), ...) I get th error: 'Dimensions must be equal, but are 7 and 1791 for '{{node Equal_1}} '", "1082257": "Thank you very much for these insights!!! \n\nCould you please explain, how you trained stage 1 Model mit additional output of the GAP-layer?\nCompiling the \n\nmodel = Model (model input, [x, GAP]) I used\nmodel.compile(\n optimizer='adam',\n loss = [tf.keras.losses.BinaryCrossentropy(from_logits=True), None],\n metrics=['accuracy'])\n\nwith no problems, but with\n\nmodel.fit(get_training_dataset(), ...) I always get 'Dimensions must be equal, but are 7 and 1792 for '{{node Equal_1}} = Equal[T=DT_FLOAT, incompatible_shape_error=true](Cast_18, Cast_20)' with input shapes: [?,7], [?,1792].'", "1073690": "Thank you @cdeotte and congrats on the finish! I have been following your work since ISIC Melonama and it is always a pleasure to read :) \n\nCould I please ask how you trained `Stage 1 - Model Two - Patient Level Predictions`? \n\nI am a bit confused by: \n> then take the 9 average predictions.\n\nWhere are these 9 predictions coming from? And what are the labels used to train the model? Sorry if it's a silly question.", "1065308": "Great job!", "1065047": "Wow, learnt a lot of new stuff, thanks", "1063967": "Great work @cdeotte.. May be a naive question. the first model the pe_present_on_image has been multiplied by 5.6222. Any reason?. ", "1063662": "This was a great read.", "1063536": "This is an advanced topic, thanks for sharing your insight", "1062940": "Your explanations are always very detailed and contain great visuals to even better illustrate your work. Great stuff and thanks for sharing!", "1062615": "Good strategy. I tried the efficient B > 3 give me \"CSV not found\" or timeout. My bad bc I can't control it. Learn more from you.", "1062614": "Your write-up is a master class in clean code and experimentation. Thanks for sharing. ", "1062534": "Thanks for sharing your clear and concise solution, @cdeotte! \n\nIn the part of Stage 2 model two, you noted that: \n\n> Then we took those 64 images and extracted the GAP embeddings from both our stage 1 model one and stage 1 model two.\n\nThis might be a beginner's question, but what exactly is the GAP embedding? ", "1062448": "Good job on your place. Very well deserved!", "1062426": "Very good solution and approach ! Best work ", "1061695": "learned a lot from seeing your solution @cdeotte. now i know where i went wrong in my approaches. next time I am going to spend some more time on experiments with lesser data and smaller model.", "1061434": "Congrats on results @cdeotte and thanks for sharing the detailed solution !!", "1061361": "Congrats Chris! ", "1061356": "Congrats on results and thanks for the writeup details solution @cdeotte", "1061669": "Congratz on the nice finish Chris !\n\nI'm always impressed by your write-ups, they really make your solution stand out, and are pleasant to read.", "1061585": "Hi @cdeotte . Thank you for the amazing write up. I am impressed by your simple and easy flowing explanation in all the competitions :). Keep Shining. ", "1061515": "Wow ! Its amazing how you get the time to create and run so many experiments AND document it too !!\nThank you and congratulations ", "1061424": "Congratulations Dr. @cdeotte. You are truly an inspiration for newbies.. Thanks a lot for sharing the amazing concepts that fueled your solution... ", "1061380": "Thank you for sharing. Great work @cdeotte . Very informative and I need more time to read.", "1061365": "You show the power of the NVIDIA device, I decided to buy a Tesla V100 after this competition.", "1061331": "There is alot to learn from @cdeotte Thanks for sharning", "1062803": "", "1065142": "Thanks for sharing !", "1064056": "Thanks for sharing.", "1063675": "This was of great help . Thank You !", "1063009": "Thanks for Sharing!!!", "1064062": "Thanks for sharing!!" } }