\n
Table of content
\n
Part 1: Domain Info \n \n■ [1. What is Pulmonary Embolism (PE)?](#1)
\n■ [2. How is PE diagnosed?](#2)
\n■ [3. Right PE](#3)
\n■ [4. Left PE ](#4)
\n■ [5. Central PE](#5)
\n■ [6. Acute vs. Chronic PE](#6)
\n■ [7. Right Ventricle/Left Ventricle Ratio](#7)
\n■ [8. Treatment of PE](#8)
\n■ [9. References](#9)
\n \n
Part 2: Exploratory Data Analysis (EDA)\n■ [10. Loading Libraries ](#10)"},{"metadata":{"_uuid":"d629ff2d2480ee46fbb7e2d37f6b5fab8052498a","collapsed":true,"_cell_guid":"79c7e3d0-c299-4dcb-8224-4455121ee9b0","trusted":false},"cell_type":"markdown","source":"\n
\n
1. What is Pulmonary Embolism (PE)? \n\n
Go to TOC\n\nA pulmonary embolism (PE) is a blood clot in the blood vessels of the lungs that can be potentially life-threatening. PEs typically arise from blood clots in the leg veins (deep vein thromboses, or DVTs) that dislodge and become trapped in the pulmonary vasculature. The clinical presentation of PE can vary from asymptomatic to severe illness requiring intensive care (shock, cardiac arrest, etc).
It can damage part of the lung due to restricted blood flow, decrease oxygen levels in the blood, and affect other organs as well. Large or multiple blood clots can be fatal. The blockage can be life-threatening. According to the [Mayo Clinic](https://www.mayoclinic.org/diseases-conditions/pulmonary-embolism/symptoms-causes/syc-20354647), it results in the death of one-third of people who go undiagnosed or untreated. However, immediate emergency treatment greatly increases your chances of avoiding permanent lung damage.\n\n
\n
2. How is PE diagnosed?\n\n
Go to TOC\n\n\nThere are various tools for diagnosing PE; however, current practice relies primarily on CT angiography. Intravenous contrast is administered through the patient's veins just prior to obtaining the CT, and the CT scan is timed to obtain images when the contrast is primarily in the pulmonary blood vessels. **Note: this is where quality issues can occur.** Sometimes the timing of the scan is off, resulting in a suboptimal scan. This can result in non-diagnostic or equivocal studies. In addition, if the patient is moving a lot or has metal in their body, this can cause artifacts which may obscure a clot.\n\n\nThis image shows a single axial slice of a CT pulmonary angiogram (CTPA or CTPE) at this level of the pulmonary trunk. The pulmonary trunk (the
green annotated part in the image ) is a major blood vessel that comes from the right side of your heart to supply blood to your lungs. Note how bright the blood vessels are - this is due to the intravenous contrast.\n\n\n\nIn this image, notice how there are
\"filling defects\" in red color in the pulmonary trunk. Unlike the previous image, there are areas in the
blood vessels (marked in red) that are more gray. This is evidence of a pulmonary embolism in the blood vessel, as the blood clot prevents the contrast from filling up the entire vessel.
This type of PE would be a central PE in our dataset (it is in the central blood vessel of the lungs). \n\n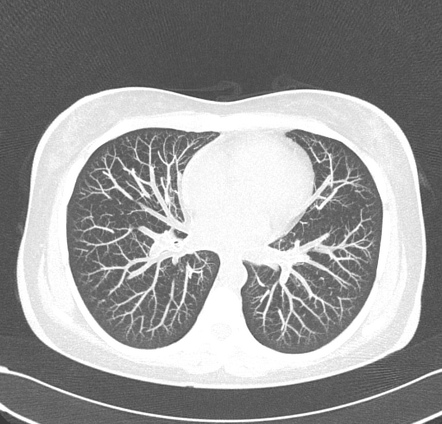\nNote that PEs can occur anywhere in the lung vasculature, which is very extensive and resembles a tree.
However, the finding we are looking for is the same: filling detects. . Patients can have multiple PEs across both lungs: hence, we have labels for right-sided, left-sided, and central PEs, but these are not mutually exclusive which means same image can have more than one-sided PEs. \n\n
\n
3. Right PE \n\n
Go to TOC\n\n\nIn the image above, Acute occlusive pulmonary embolism in a 32-year-old woman who presented with chest pain. CT scan shows a pulmonary embolus within the posterobasal segment of the
right lower lobe artery (arrow). The artery is enlarged compared with adjacent patent vessels.\n\n
\n
4. Left PE \n\n
Go to TOC\n\n\n\nIn the image above, Acute pulmonary embolism in a 58-year-old woman who presented with chest pain and dyspnea. CT scan demonstrates a pulmonary embolus that results in an eccentrically positioned partialfilling defect, which is surrounded by contrast material and forms acute angles with the arterial wall (arrows) is left PE\n\n
\n
5. Central PE \n\n
Go to TOC\n\n 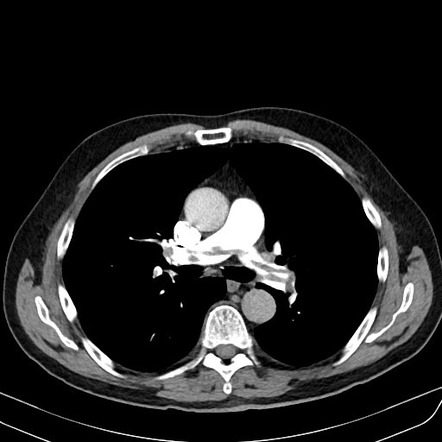\nIn this image above, notice how there are \"filling defects\" in the pulmonary trunk. This is evidence of a pulmonary embolism in the blood vessel, as the blood clot prevents the contrast from filling up the entire vessel. This type of PE would be a central PE in our dataset (it is in the central blood vessel of the lungs).\n\n
\n
6. Acute vs. Chronic PE \n\n
Go to TOC\n\n \nNot all PEs result in symptoms. Generally, acute (sudden-onset) PEs are more likely to cause symptoms, as your body has not had time to adapt to the presence of a clot. There are imaging findings that can distinguish acute from chronic PEs, but this can be challenging to discern. For more on this topic you can have a look at this paper [Acute and Chronic Pulmonary Emboli: Angiography–CT Correlation](https://www.ajronline.org/doi/pdf/10.2214/AJR.04.1955)\n\n\n
\n
7. Right Ventricle/Left Ventricle Ratio \n\n
Go to TOC\n\nYour heart has 4 chambers. The muscular chambers that do most of the pumping are known as the ventricles. Your right ventricle pumps blood to your lungs; your left ventricle pumps blood to the rest of your body.\n\n\n\n\nRemember - everything is flipped in radiology, so the RIGHT SIDE of the body is on the LEFT, and vice versa. That giant ball just off-center in this image is the heart. Normally, your left ventricle (lower right) is larger than your right ventricle (upper left), like in this image above. This is because the left ventricle has a much harder job to do: pump body throughout the entire body versus just the lungs. \n\n\nHowever, having a PE can put a big strain on the right side of your heart. Intuitively, this makes sense - if you have a blockage in the blood vessels in your lungs, the right side of your heart has to work a lot harder to try and pump blood through the obstruction. Sometimes, we can see evidence of this on the CT - we call this **right heart strain**. This suggests a more severe PE because the blood clot is forcing your right heart to work harder and causing blood to become backed up into the right ventricle (it's just plumbing!). We can measure the ratio of diameters of the right ventricle to the left ventricle to see if this is high. A high ratio is suggestive of right heart strain.\n\n\n\nNotice how the upper left part (right ventricle) is much larger than the lower right part (left ventricle). This patient is having a severe PE causing significant right heart strain.\n\nBecause of its importance as a prognostic indicator,
**detecting RV/LV ratio > 1** in this competition is weighed most heavily across all the other classes. Please note that this is a 3D image.
The proper way to compute RV/LV ratio is to find the maximum diameter across all slices. The maximum diameters of each ventricle are usually on different slices.\n\n
\n
8. Treatment of PE \n\n
Go to TOC\n\nTreatment depends on the severity of the clot. Typically, we will use blood thinners, either IV or oral. In severe cases, we may attempt catheter-directed thrombolysis. An interventional radiologist inserts a catheter into the pulmonary blood vessels to deliver clot-busting medication directly to the clot. Rarely, surgery may be required.\n\n\n\n
\n
9. References \n\n
Go to TOC\n\n■ [Pulmonary Embolism: A Brief Intro](https://www.kaggle.com/c/rsna-str-pulmonary-embolism-detection/discussion/182376) by [Dr. Ian Pan](https://www.kaggle.com/vaillant)
\n■ https://www.rsna.org/
\n■ https://prod-images-static.radiopaedia.org/images/17056972/2ef2ae41c8a0b5a070aa21140a14e0_gallery.jpeg
\n■ [Mattia Arrigo et.al, Right Ventricular Failure: Pathophysiology, Diagnosis And Treatment](https://www.cfrjournal.com/articles/Right-Ventricular-Failure)
\n■ [The Ratio of Descending Aortic Enhancement to Main Pulmonary Artery Enhancement Measured on Pulmonary CT Angiography as a Finding to Predict Poor Outcome in Patients with Massive or Submassive Pulmonary Embolism](https://www.researchgate.net/publication/233889701_The_Ratio_of_Descending_Aortic_Enhancement_to_Main_Pulmonary_Artery_Enhancement_Measured_on_Pulmonary_CT_Angiography_as_a_Finding_to_Predict_Poor_Outcome_in_Patients_with_Massive_or_Submassive_Pulmona)
\n■ [Acute and Chronic Pulmonary Emboli: Angiography–CT Correlation](https://www.ajronline.org/doi/pdf/10.2214/AJR.04.1955)
\n■ [Pulmonary embolism Acute vs Chronic](https://myradiotraining.blogspot.com/p/pulmonary-embolism-acute-vs-chronic.html)
\n\n\n"},{"metadata":{"trusted":true},"cell_type":"code","source":"from IPython.display import YouTubeVideo\n\nYouTubeVideo('1IBvrOBQ268', width=800, height=600)","execution_count":null,"outputs":[]},{"metadata":{},"cell_type":"markdown","source":"### 1. Importing Libraries"},{"metadata":{"trusted":true},"cell_type":"code","source":"# data reading and manipulation libraries\nimport numpy as np, pandas as pd\n\n# navigation and directory management libraries\nimport os, glob, pydicom, imageio\n\n#data visualization libraries\nimport matplotlib.pyplot as plt, seaborn as sns, plotly.express as px\nfrom IPython import display\n\n# Machine Learning Libraries\nimport tensorflow as tf\nimport keras","execution_count":null,"outputs":[]},{"metadata":{},"cell_type":"markdown","source":"### 2. Setting environment paths\nFile descriptions in the given dataset is as follows: \n* **test** - all test images directory\n* **train** - all train images directory (note that your submission kernels will NOT have access to this set of images, so you must build your models elsewhere and incorporate them into your submissions)\n* **sample_submission.csv** - contains rows for each UID+label combination that requires a prediction. Therefore it has a row for each image (for which you will be predicting the existence of a pulmonary embolism within the image) and row for each study+label that requires a study-level prediction.\n* **train.csv** - contains UIDs and all labels.\n* **test.csv** - contains UIDs."},{"metadata":{"trusted":true},"cell_type":"code","source":"PATH = \"../input/rsna-str-pulmonary-embolism-detection/\"\n\ntrain_df = pd.read_csv(PATH + \"train.csv\")\ntest_df = pd.read_csv(PATH + \"test.csv\")\n\nTRAIN_PATH = PATH + \"train/\"\nTEST_PATH = PATH + \"test/\"\nsub = pd.read_csv(PATH + \"sample_submission.csv\")\ntrain_image_file_paths = glob.glob(TRAIN_PATH + '/*/*/*.dcm')\ntest_image_file_paths = glob.glob(TEST_PATH + '/*/*/*.dcm')\n\nprint(f'Train dataframe shape :{train_df.shape}')\nprint(f'Test dataframe shape :{test_df.shape}')\n\nprint(f'Number of train images : {len(train_image_file_paths)}')\nprint(f'Number of test images : {len(test_image_file_paths)}')","execution_count":null,"outputs":[]},{"metadata":{},"cell_type":"markdown","source":"Lets make a function to read data from the dicom file. Unlike the regular image files, the DICOM files contains a lot of infomation in addition to the raw pixel values. If you want to have a in depth look inside reading dicom files, you can have a look at its official documentation. "},{"metadata":{},"cell_type":"markdown","source":"### 3. Utility functions"},{"metadata":{"_kg_hide-output":true,"trusted":true},"cell_type":"code","source":"def read_dicom(file_path, show = False, cmap = 'gray'):\n im = pydicom.read_file(file_path)\n image_unscaled = im.pixel_array\n image_rescaled = im.pixel_array * im.RescaleSlope + im.RescaleIntercept\n \n image_rescaled[image_rescaled <-1500] = 0\n \n if show:\n f, axarr = plt.subplots(1,2)\n axarr[0].imshow(image_unscaled, cmap = cmap)\n axarr[0].axis(False)\n axarr[0].set_title('no_rescale')\n \n axarr[1].imshow(image_rescaled, cmap = cmap)\n axarr[1].axis(False)\n axarr[1].set_title('windowed')\n return image_rescaled\n\n\nimage = read_dicom(train_image_file_paths[2200], show = True)\nimage.dtype","execution_count":null,"outputs":[]},{"metadata":{},"cell_type":"markdown","source":"### 4. Let's have a look at the dataframes. \nLet's print out the data fields of the training data frame. "},{"metadata":{"trusted":true},"cell_type":"code","source":"train_df.info()","execution_count":null,"outputs":[]},{"metadata":{},"cell_type":"markdown","source":"We see that there are 16 fields in total among them the first three are the identifiers (IDs). Here the first one is the `StudyInstanceUID`, `SeriesInstanceUID` and `SOPInstanceUID` are strings and the rest 13 are int64 which are essentially boolian data. Now let's have a look at the actual data itself. "},{"metadata":{"trusted":true},"cell_type":"code","source":"train_df.head(30)","execution_count":null,"outputs":[]},{"metadata":{},"cell_type":"markdown","source":"From the documentation we get the follwoing information about the columns of the dataframes. \n\n| Field Name | Feature Type | Description |\n| :--- | :--- | :---- |\n| **StudyInstanceUID** | UID | unique ID for each study (exam) in the data. |\n| **SeriesInstanceUID** | UID | unique ID for each series within the study. |\n| **SOPInstanceUID** | UID | unique ID for each image within the study (and data) |\n| **pe_present_on_image**| image-level | notes whether any form of PE is present on the image.|\n| **negative_exam_for_pe**| exam-level | whether there are any images in the study that have PE present.|\n| **qa_motion** | informational | indicates whether radiologists noted an issue with motion in the study. | \n|**qa_contrast** | informational | indicates whether radiologists noted an issue with contrast in the study.|\n| **flow_artifact** | informational | ---|\n| **rv_lv_ratio_gte_1** | exam-level| indicates whether the RV/LV ratio present in the study is >= 1|\n| **rv_lv_ratio_lt_1** | exam-level| indicates whether the RV/LV ratio present in the study is < 1|\n| **leftsided_pe** | exam-level | indicates that there is PE present on the left side of the images in the study| \n| **chronic_pe** | exam-level | indicates that the PE in the study is chronic|\n| **true_filling_defect_not_pe** | informational | indicates a defect that is NOT PE|\n| **rightsided_pe** | exam-level | indicates that there is PE present on the right side of the images in the study|\n| **acute_and_chronic_pe** | exam-level| indicates that the PE present in the study is both acute AND chronic|\n| **central_pe** | exam-level| indicates that there is PE present in the center of the images in the study|\n| **indeterminate** | exam-level| indicates that while the study is not negative for PE, an ultimate set of exam-level labels could not be created, due to QA issues|\n\n
\n\n### What is `image-level` and `exam-level` features:\nIn this competition, `image-level` feature prediction means you have to find predict that particular feature for each of the image separately. Here all the images are unique.\n\nOn the contrary `exam-label` feature means you have to characterize that particular image exam or observation. Here one thing should be very clear that one exam has many images. Here the prediction is based on the experiment/examination. \n\nThe following image is a flowchart outlining the relationships between labels. Note that there are four labels in the training set that are purely informational and require no predictions. They are `QA Contrast`, `QA Motion`, `True filling defect not PE`, and `Flow artifact`, and are not scored, but are meant to be used as helpers. Also note that `Acute PE` is not an explicit label, but is implied by the lack of `Chronic PE `or A`cute and Chronic PE`.\n\n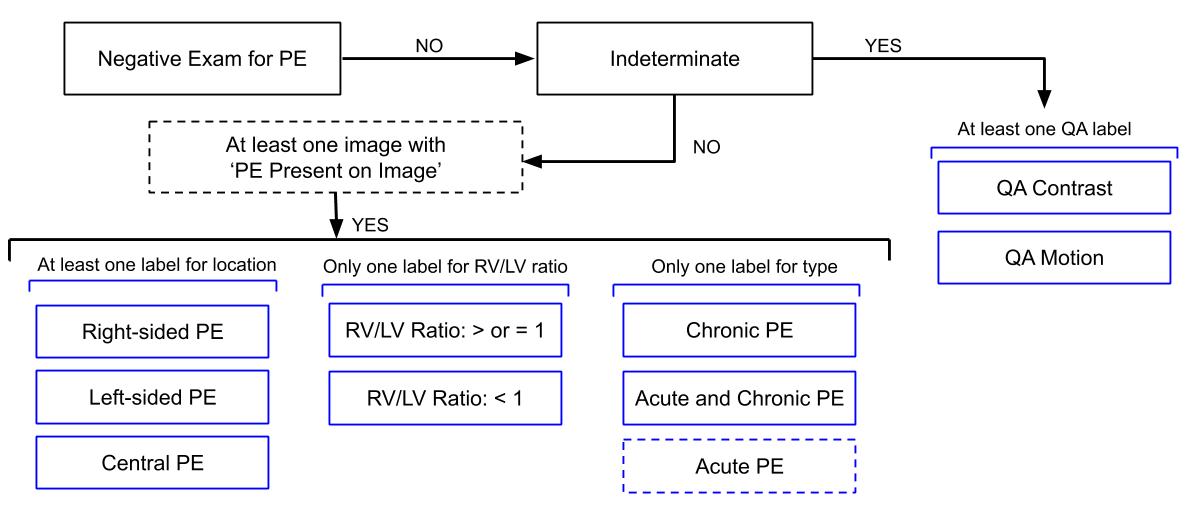\n"},{"metadata":{},"cell_type":"markdown","source":"#### Test Data Frame\nNow let's have a look at the test dataframe. We see that we have only three columns. "},{"metadata":{"trusted":true},"cell_type":"code","source":"test_df.info()","execution_count":null,"outputs":[]},{"metadata":{"trusted":true},"cell_type":"code","source":"test_df.head()","execution_count":null,"outputs":[]},{"metadata":{},"cell_type":"markdown","source":"Now let us have a look at the sample submission file so that we can understand what to predict from all the images. **"},{"metadata":{"trusted":true},"cell_type":"code","source":"sub.info()","execution_count":null,"outputs":[]},{"metadata":{"trusted":true},"cell_type":"code","source":"from tqdm.notebook import tqdm\nprediction_counts = {}\nfor idx in tqdm(range(sub.shape[0])):\n if len(sub['id'][idx][13:]) > 1:\n key = sub['id'][idx][13:]\n else:\n key = 'pe_present_on_image'\n prediction_counts[key] = prediction_counts.get(key, 0) + 1\nprint(f'Total row count in submission: {sub.shape[0]}')\nprediction_counts","execution_count":null,"outputs":[]},{"metadata":{},"cell_type":"markdown","source":"## Submission size calculation for correctness: \n\nHere among the labels given in the training data, `pe_present_on_image` is the image level feature that needs to be predicted for all the images. \n\nAnd the rest of the features will be predicted for only the exam. In that case each exam will have multiple images. But for that whole group we will submit only one set of prediction for those following labels:\n \n * negative_exam_for_pe\n * rv_lv_ratio_gte_1\n * rv_lv_ratio_lt_1\n * leftsided_pe\n * chronic_pe\n * rightsided_pe\n * acute_and_chronic_pe\n * central_pe\n * indeterminate\n \nTherefore our prediction file should have a number of rows equal to: $$(N_{img}) + (N_{exams} * N_{examlevelfeature}).$$\n\nFor example, In the above calculation we have 650 examination and 146853 images in total. So the total number of rows in the submission file will \n"},{"metadata":{"trusted":true},"cell_type":"code","source":"N_img = 146853\nN_exams = 650\nN_exam_level_features = 9\n\ntotal_rows_submission = N_img + (N_exams * N_exam_level_features)\nprint(f'Total row count in submission: {total_rows_submission}')","execution_count":null,"outputs":[]},{"metadata":{},"cell_type":"markdown","source":"Here for each of the image we must have to predict the property `pe_present_on_image` which actually indicates wherther Pulmonary Embolism (PE) is present in the image. \nLet's compare them. "},{"metadata":{"trusted":true},"cell_type":"code","source":"def plot_bar(col):\n ds = train_df[col].value_counts().reset_index()\n ds.columns = ['value', 'number']\n fig = px.bar(ds, x='value', y=\"number\", orientation='v',title='Distribution of train set for ' + col, width=500, height=400 )\n fig.show()\n\nplot_bar('pe_present_on_image')","execution_count":null,"outputs":[]},{"metadata":{"trusted":true},"cell_type":"code","source":"dcm_file = pydicom.read_file(\"../input/rsna-str-pulmonary-embolism-detection/train/0003b3d648eb/d2b2960c2bbf/00ac73cfc372.dcm\")\nprint(dcm_file.file_meta)","execution_count":null,"outputs":[]},{"metadata":{},"cell_type":"markdown","source":"In addition to them, there are lot of important information in the dicom file. You can easily extract those information from the dicom files and use them in the preprocessing steps of these CT-Scans. Let's have a look at the additional paramers stored in the dicom files. "},{"metadata":{},"cell_type":"markdown","source":"So the class of this is a CT scan, the implementation is dcm4che (potentially expanded form DCM for Chest), and you have all the standard metadata of a DICOM file for the lungs. Do some little checks on the pixel array:"},{"metadata":{"trusted":true},"cell_type":"code","source":"dcm_file","execution_count":null,"outputs":[]},{"metadata":{},"cell_type":"markdown","source":"Here among these large number of parameter, there are several paramers that a radiologist must have a good understanding of. They are \n\n|Field Code|Variable Name|Value|\n|---|:---|:---|\n|(0020, 0013)| Instance Number | IS: \"40\"|\n|(0028, 0030)| Pixel Spacing | DS: [0.871094,0.871094]|\n|(0028, 1050)| Window Center | DS: \"40.0\"|\n|(0028, 1051)| Window Width | DS: \"400.0\"|\n|(0028, 1052)| Rescale Intercept | DS: \"-1024.0\"|\n|(0028, 1053)| Rescale Slope | DS: \"1.0\"|\n\nThese parameters are must needed for preprocessing the CT-Scans. Without these parameters it will be very difficult to fully utilize the potential of the CT-Scans. "},{"metadata":{"trusted":true},"cell_type":"code","source":"image = dcm_file.pixel_array\nprint(f'Image Size: {image.shape}')","execution_count":null,"outputs":[]},{"metadata":{},"cell_type":"markdown","source":"Now we have the images of 512x512 size, we can have a look at the distribution of the pixel values. "},{"metadata":{"trusted":true},"cell_type":"code","source":"fig, ax = plt.subplots(2,1,figsize=(20,10))\nfor file in train_image_file_paths[0:10]:\n dataset = pydicom.read_file(file)\n image = dataset.pixel_array.flatten()\n rescaled_image = image * dataset.RescaleSlope + dataset.RescaleIntercept\n sns.distplot(image.flatten(), ax=ax[0]);\n sns.distplot(rescaled_image.flatten(), ax=ax[1])\nax[0].set_title(\"Raw pixel array distributions for 10 examples\");","execution_count":null,"outputs":[]},{"metadata":{},"cell_type":"markdown","source":"Now let's have a look at the images of the training set. In the following image, 15 of the images are just displayed. As a title of the images, I have set the maximum and minimum value of the pixel which explains why some of the slices are darker than the others. "},{"metadata":{"trusted":true},"cell_type":"code","source":"counter = 0\nrows = 3\ncols = 5\nfig = plt.figure(figsize=(25,15))\nfor i in range(1, rows*cols+1):\n img = read_dicom(train_image_file_paths[counter + i])\n fig.add_subplot(rows, cols, i)\n plt.imshow(img, cmap='gray')\n plt.title(f'[{img.min()} {img.max()}]')\n plt.axis(False)\n fig.add_subplot\ncounter += rows*cols","execution_count":null,"outputs":[]},{"metadata":{},"cell_type":"markdown","source":"In the above image, just the images are printed irrespective of any of the patients. Now we will just have a look at a single exam and will observe if the images are of same patient or different patient. "},{"metadata":{"trusted":true},"cell_type":"code","source":"selected_exam = 10\nEXAM_IDs = os.listdir(TRAIN_PATH)\nSERIES = os.listdir(TRAIN_PATH + '/' + EXAM_IDs[selected_exam])\nfiles = os.listdir(TRAIN_PATH + '/' + EXAM_IDs[selected_exam] + '/' + SERIES[0])\nsingle_experiment_files = [TRAIN_PATH + '/' + EXAM_IDs[selected_exam] + '/' + SERIES[0] + '/' + file for file in files]\n","execution_count":null,"outputs":[]},{"metadata":{"trusted":true},"cell_type":"code","source":"counter = 0\nrows = 3\ncols = 5\nfig = plt.figure(figsize=(25,15))\nfor i in range(1, rows*cols+1):\n fig.add_subplot(rows, cols, i)\n plt.imshow(read_dicom(single_experiment_files[counter + i]), cmap='gray')\n plt.axis(False)\n fig.add_subplot\ncounter += rows*cols","execution_count":null,"outputs":[]},{"metadata":{},"cell_type":"markdown","source":"### Sequential Read:\nSo far we have been able to print the random CT-Scan Slices of the patient. However just printing and looking at the random slices don't make any sense because they have a particular sequence and they only make sense in that particualr sequence. Now in the following part of this notebook we will try to print the scans in a sequence. "},{"metadata":{"_kg_hide-input":true,"trusted":true},"cell_type":"code","source":"def load_slice(paths):\n slices = [pydicom.read_file(path) for path in paths]\n# labels = [train_df[train_df.SOPInstanceUID == path[-16:-4]].pe_present_on_image.values for path in patient_image_paths]\n# labels = np.array(labels).squeeze()\n slices.sort(key = lambda x: int(x.InstanceNumber), reverse = False)\n# labels.sort(key = lambda x: int(x.InstanceNumber), reverse = False)\n \n try:\n slice_thickness = np.abs(slices[0].ImagePositionPatient[2] - slices[1].ImagePositionPatient[2])\n except:\n slice_thickness = np.abs(slices[0].SliceLocation - slices[1].SliceLocation) \n for s in slices:\n s.SliceThickness = slice_thickness\n \n return slices\n\ndef transform_to_hu(slices):\n images = np.stack([file.pixel_array for file in slices])\n images = images.astype(np.int16)\n\n # convert ouside pixel-values to air:\n # I'm using <= -1000 to be sure that other defaults are captured as well\n images[images <= -1000] = 0\n \n # convert to HU\n for n in range(len(slices)): \n intercept = slices[n].RescaleIntercept\n slope = slices[n].RescaleSlope\n if slope != 1:\n images[n] = slope * images[n].astype(np.float64)\n images[n] = images[n].astype(np.int16) \n images[n] += np.int16(intercept)\n return np.array(images, dtype=np.int16)","execution_count":null,"outputs":[]},{"metadata":{"trusted":true},"cell_type":"code","source":"stacked_dicoms = load_slice(single_experiment_files)\nstacked_patient_pixels = transform_to_hu(stacked_dicoms)\n\ndef sample_stack(stack, rows=6, cols=6, start_with=10, show_every=3):\n fig,ax = plt.subplots(rows,cols,figsize=[20,22])\n for i in range(rows*cols):\n ind = start_with + i*show_every\n ax[int(i/rows),int(i % rows)].set_title(f'slice {ind}')\n ax[int(i/rows),int(i % rows)].imshow(stack[ind],cmap='gray')\n ax[int(i/rows),int(i % rows)].axis('off')\n plt.show()\n\nprint(f'Total Number of Slices: {len(stacked_patient_pixels)}')\nsample_stack(stacked_patient_pixels, \n show_every = int((len(stacked_patient_pixels)-10)/36))","execution_count":null,"outputs":[]},{"metadata":{},"cell_type":"markdown","source":"Still we are not able to see a live scrolling among the slides. What can we do?\nWe can make a nice gif animation and view that. :) "},{"metadata":{"trusted":true},"cell_type":"code","source":"imageio.mimsave(f'stacked_{EXAM_IDs[selected_exam]}.gif', stacked_patient_pixels, duration=0.1)\ndisplay.Image(f'stacked_{EXAM_IDs[selected_exam]}.gif', format='png')","execution_count":null,"outputs":[]},{"metadata":{},"cell_type":"markdown","source":"\n\n\n\n\n\n### In the meantime, check out my other ongoing works in this same competition: \n💥 [RSNA-STR Pulmonary Embolism [Dummy Sub]](https://www.kaggle.com/redwankarimsony/rsna-str-pulmonary-embolism-dummy-sub)
\n💥 [CT-Scans, DICOM files, Windowing Explained](https://www.kaggle.com/redwankarimsony/ct-scans-dicom-files-windowing-explained)
\n💥 [RSNA-STR-PE [Gradient & Sigmoid Windowing]](https://www.kaggle.com/redwankarimsony/rsna-str-pe-gradient-sigmoid-windowing)
\n💥 [RSNA-STR [✔️3D Stacking ✔️3D Plot ✔️Segmentation]](https://www.kaggle.com/redwankarimsony/rsna-str-3d-stacking-3d-plot-segmentation/edit/run/42517982)
\n💥 [RSNA-STR [DICOM 👉 GIF 👉 npy]](https://www.kaggle.com/redwankarimsony/rsna-str-dicom-gif-npy)
\n💥 [RSNA-STR Pulmonary Embolism [EDA]](https://www.kaggle.com/redwankarimsony/rsna-str-pulmonary-embolism-eda)
\n\n\n\n"},{"metadata":{"trusted":true},"cell_type":"code","source":"","execution_count":null,"outputs":[]}],"metadata":{"kernelspec":{"language":"python","display_name":"Python 3","name":"python3"},"language_info":{"pygments_lexer":"ipython3","nbconvert_exporter":"python","version":"3.6.4","file_extension":".py","codemirror_mode":{"name":"ipython","version":3},"name":"python","mimetype":"text/x-python"}},"nbformat":4,"nbformat_minor":4}
